| T | A | B |
|---|---|---|
| L | E | S |
Now you can display data tables in your presentations!
Like this
| Country | 2010 | 2011 | 2012 | 2013 | 2014 |
|---|---|---|---|---|---|
| USA | 2.5 | 1.6 | 2.3 | 2.2 | 2.4 |
| China | 10.6 | 9.5 | 7.8 | 7.7 | 7.4 |
| India | 10.3 | 6.6 | 5.1 | 6.9 | 7.4 |
| UK | 1.9 | 1.6 | 0.7 | 1.7 | 2.6 |
Annual GDP growth %
source: data.worldbank.org
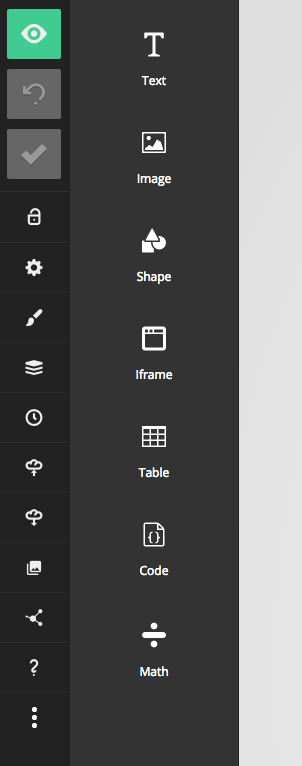
This option is available in the editor sidebar
Appearance can easily be configured
| ONE | TWO | THREE |
|---|---|---|
| 1 | 2 | 3 |
| 2 | 4 | 6 |
| 4 | 8 | 12 |
Drag to resize columns
Context-menu shortcuts
Use fragments for step-by-step build up
| ONE | ||
|---|---|---|
| 1 | ||
| 2 | ||
| 4 |
| TWO | ||
|---|---|---|
| 2 | ||
| 4 | ||
| 8 |
| THREE | ||
|---|---|---|
| 3 | ||
| 6 | ||
| 12 |
Sign in to give it a try. If you're not already a member, sign up for free.
Sign in