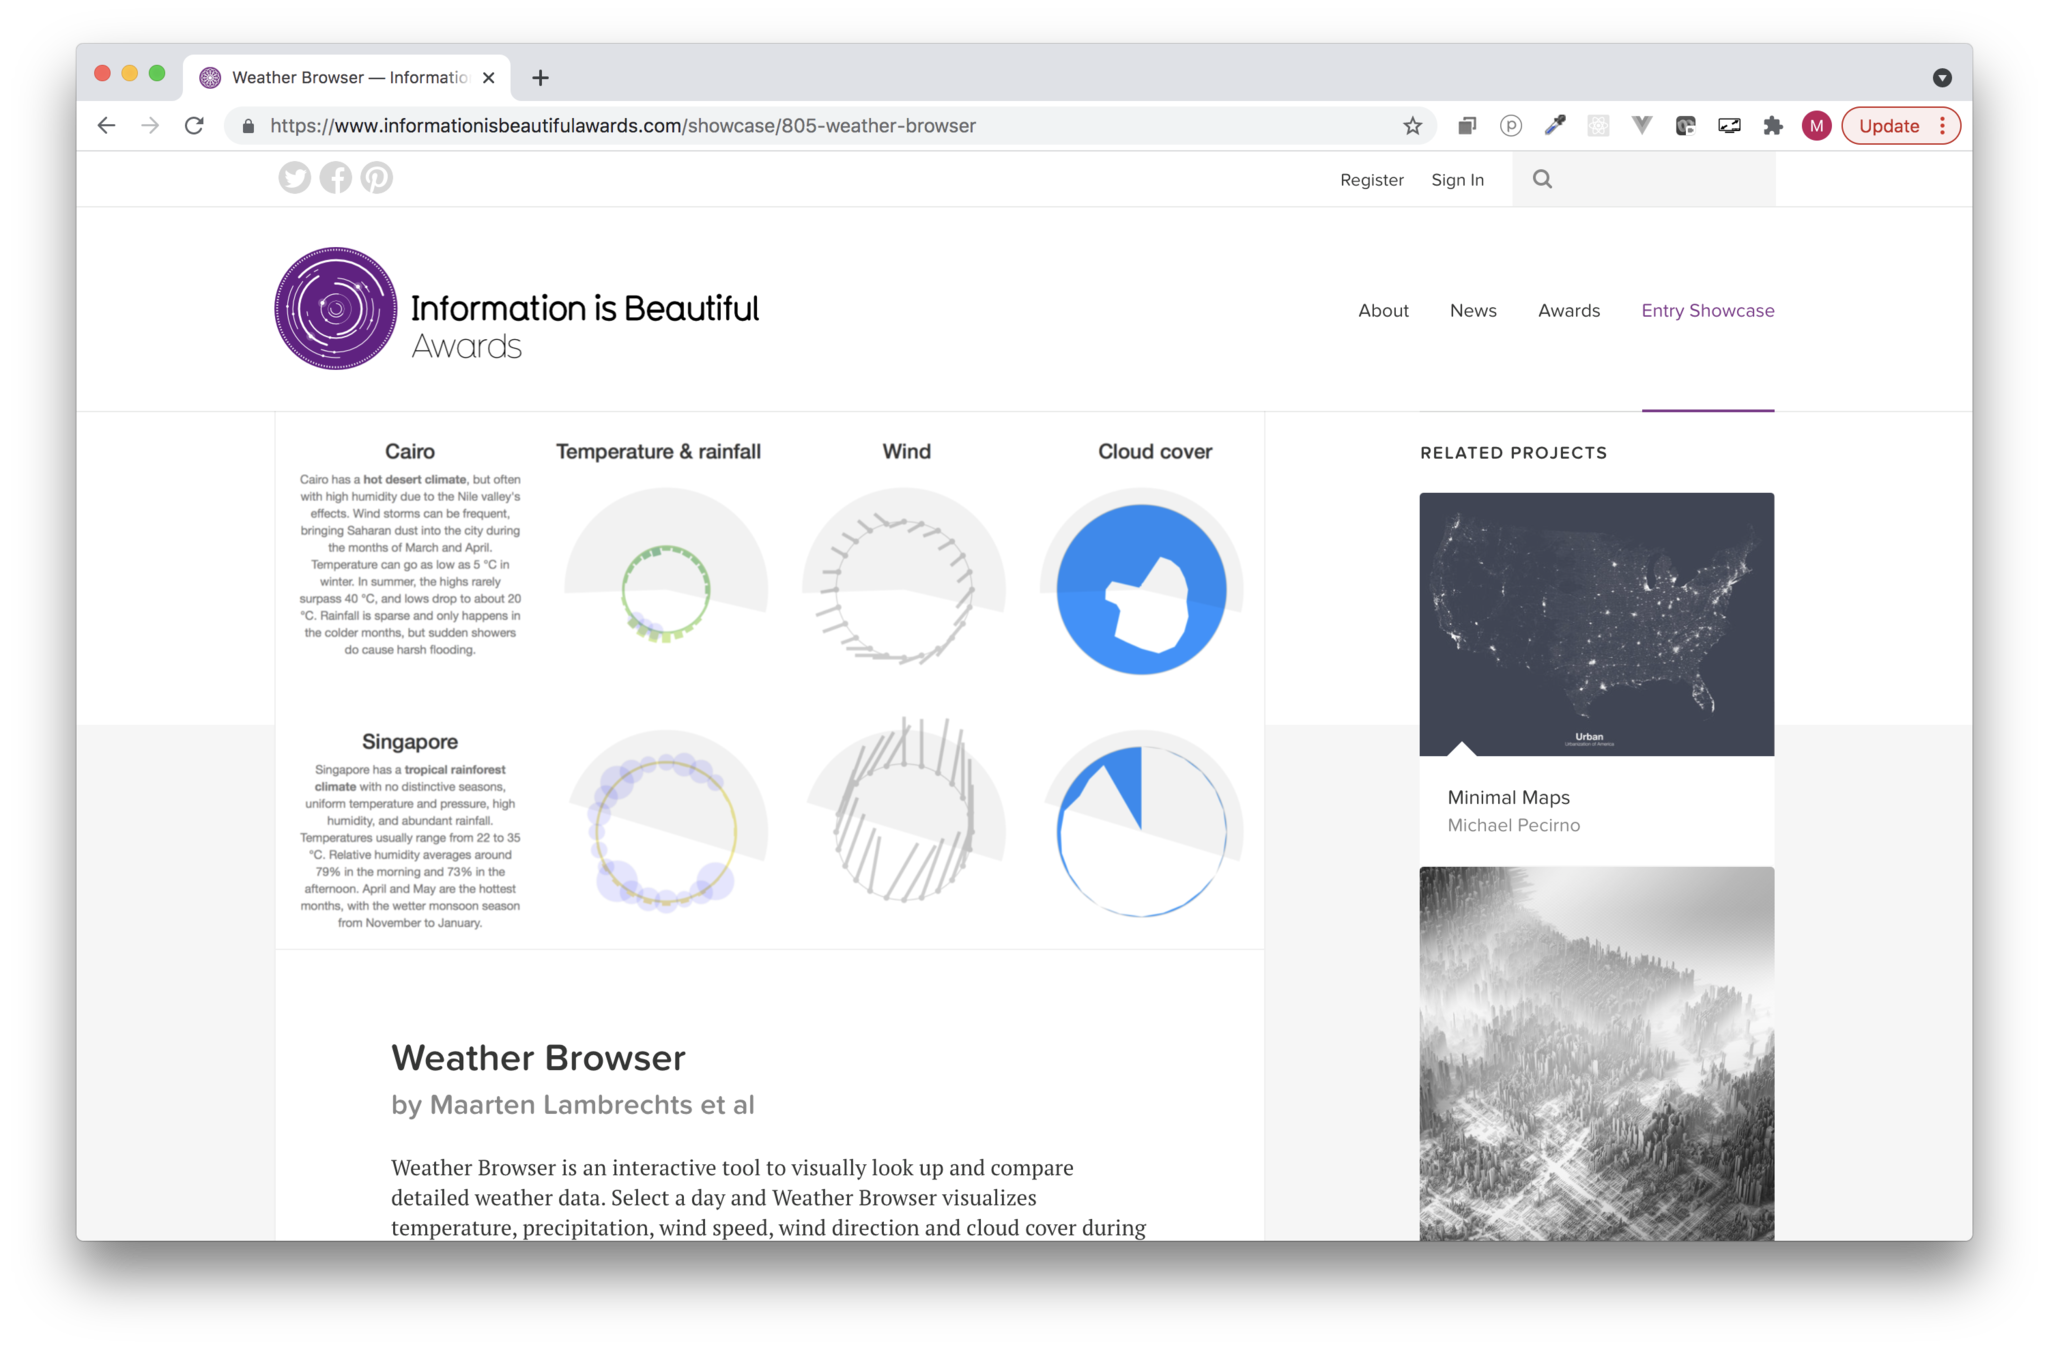
A 15 year journey through dataviz on the web
Maarten Lambrechts
From d3 v2 to svelte
CIMAT
INEGI
12 November 2021
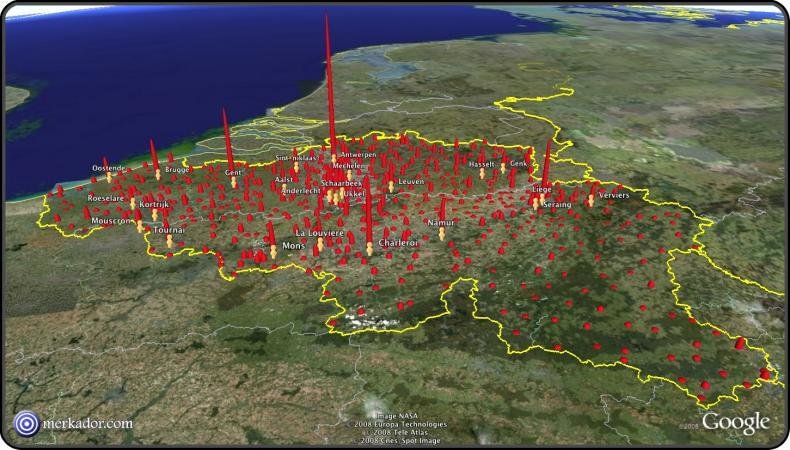
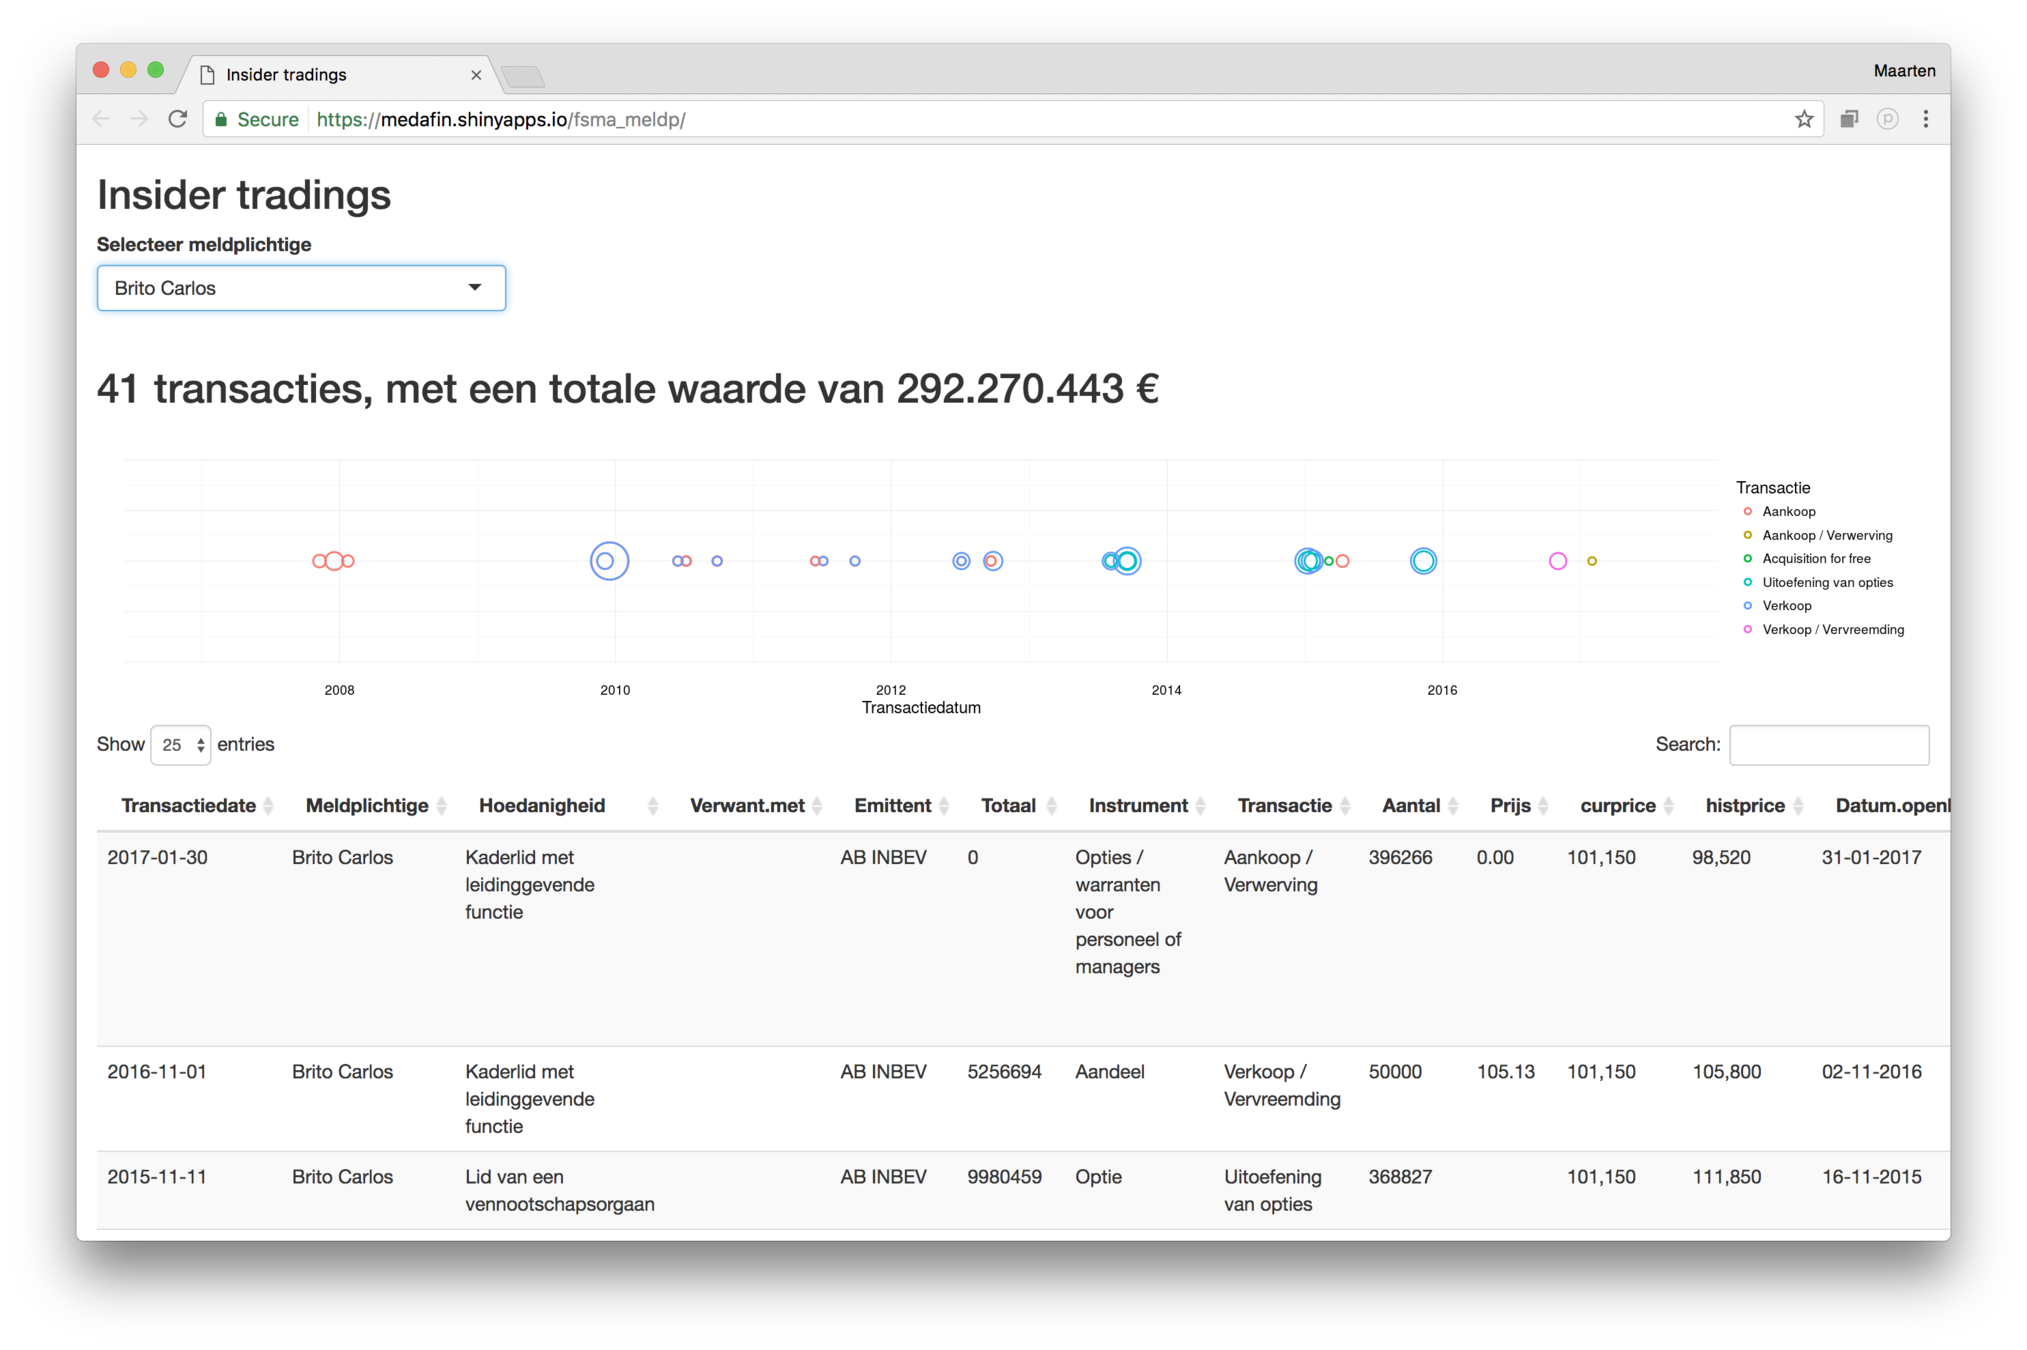
2006


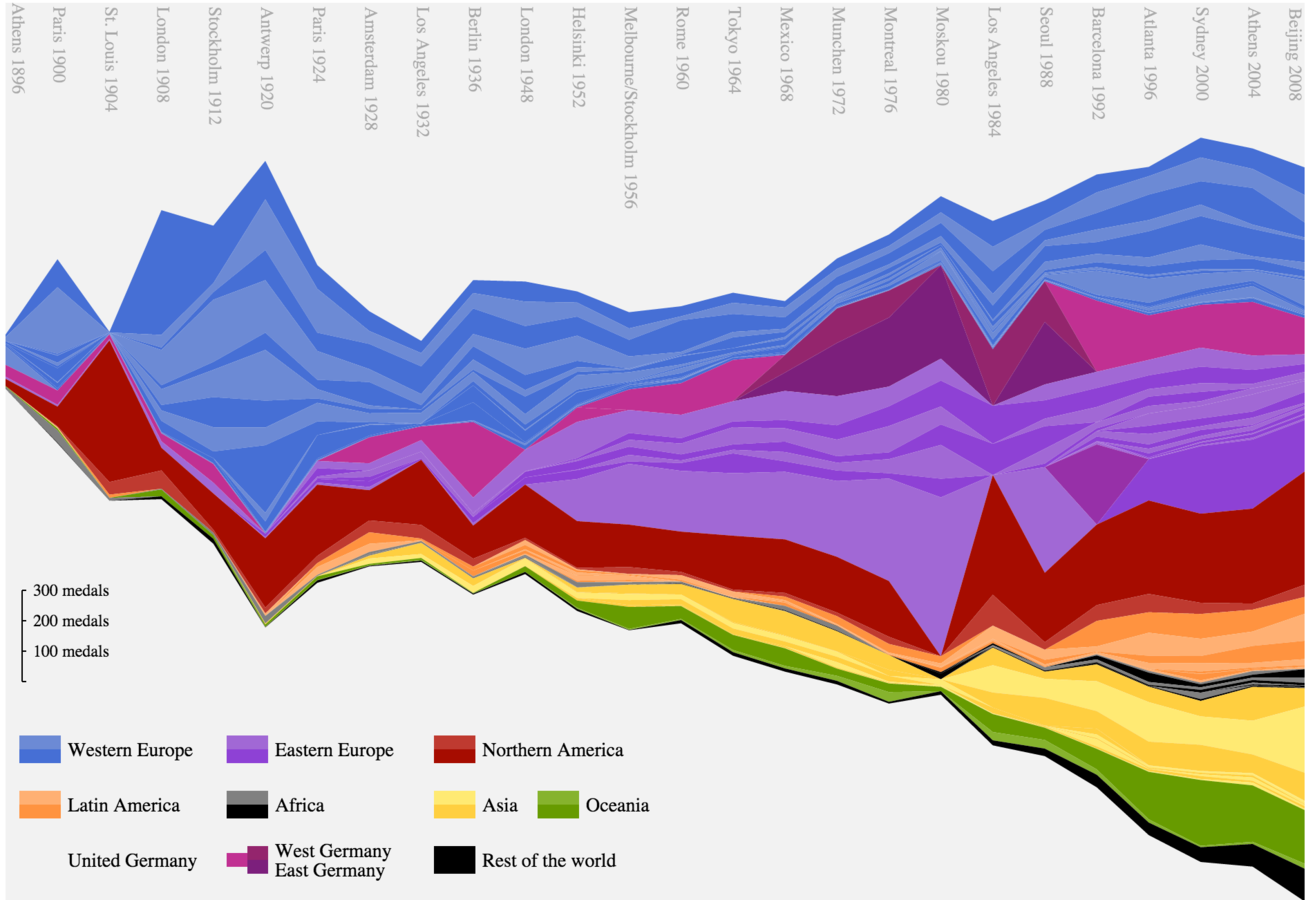
2011

<!DOCTYPE html>
<html>

<head>
    <script src="https://d3js.org/d3.min.js"></script>
</head>

<body>
    <svg id="viz">
    	// Let D3 add stuff here, and do things with it
    </svg>
</body>
<script>
    // Load data with D3
    d3.csv(...)
    // Transform data with D3
    var xScale = d3.scaleLinear()...
    // Add and update elements with D3
    d3.select("#viz").selectAll("circle")
    	.data(data)
    	.enter()
        .append("circle")
        ...
</script>

</html>
D3.js for everything
| country | income | life expectancy |
|---|
Html
svg chart
D3
| country | income | life expectancy |
|---|
Html
svg chart
D3
d3.scaleLog()
d3.scaleLinear()
Use D3 functions to calculate positions, size, ... of visual elements
Import the D3 library
| country | income | life expectancy |
|---|
Html
svg chart
D3
d3.scaleLog()
d3.scaleLinear()
Use D3 to add elements to the DOM
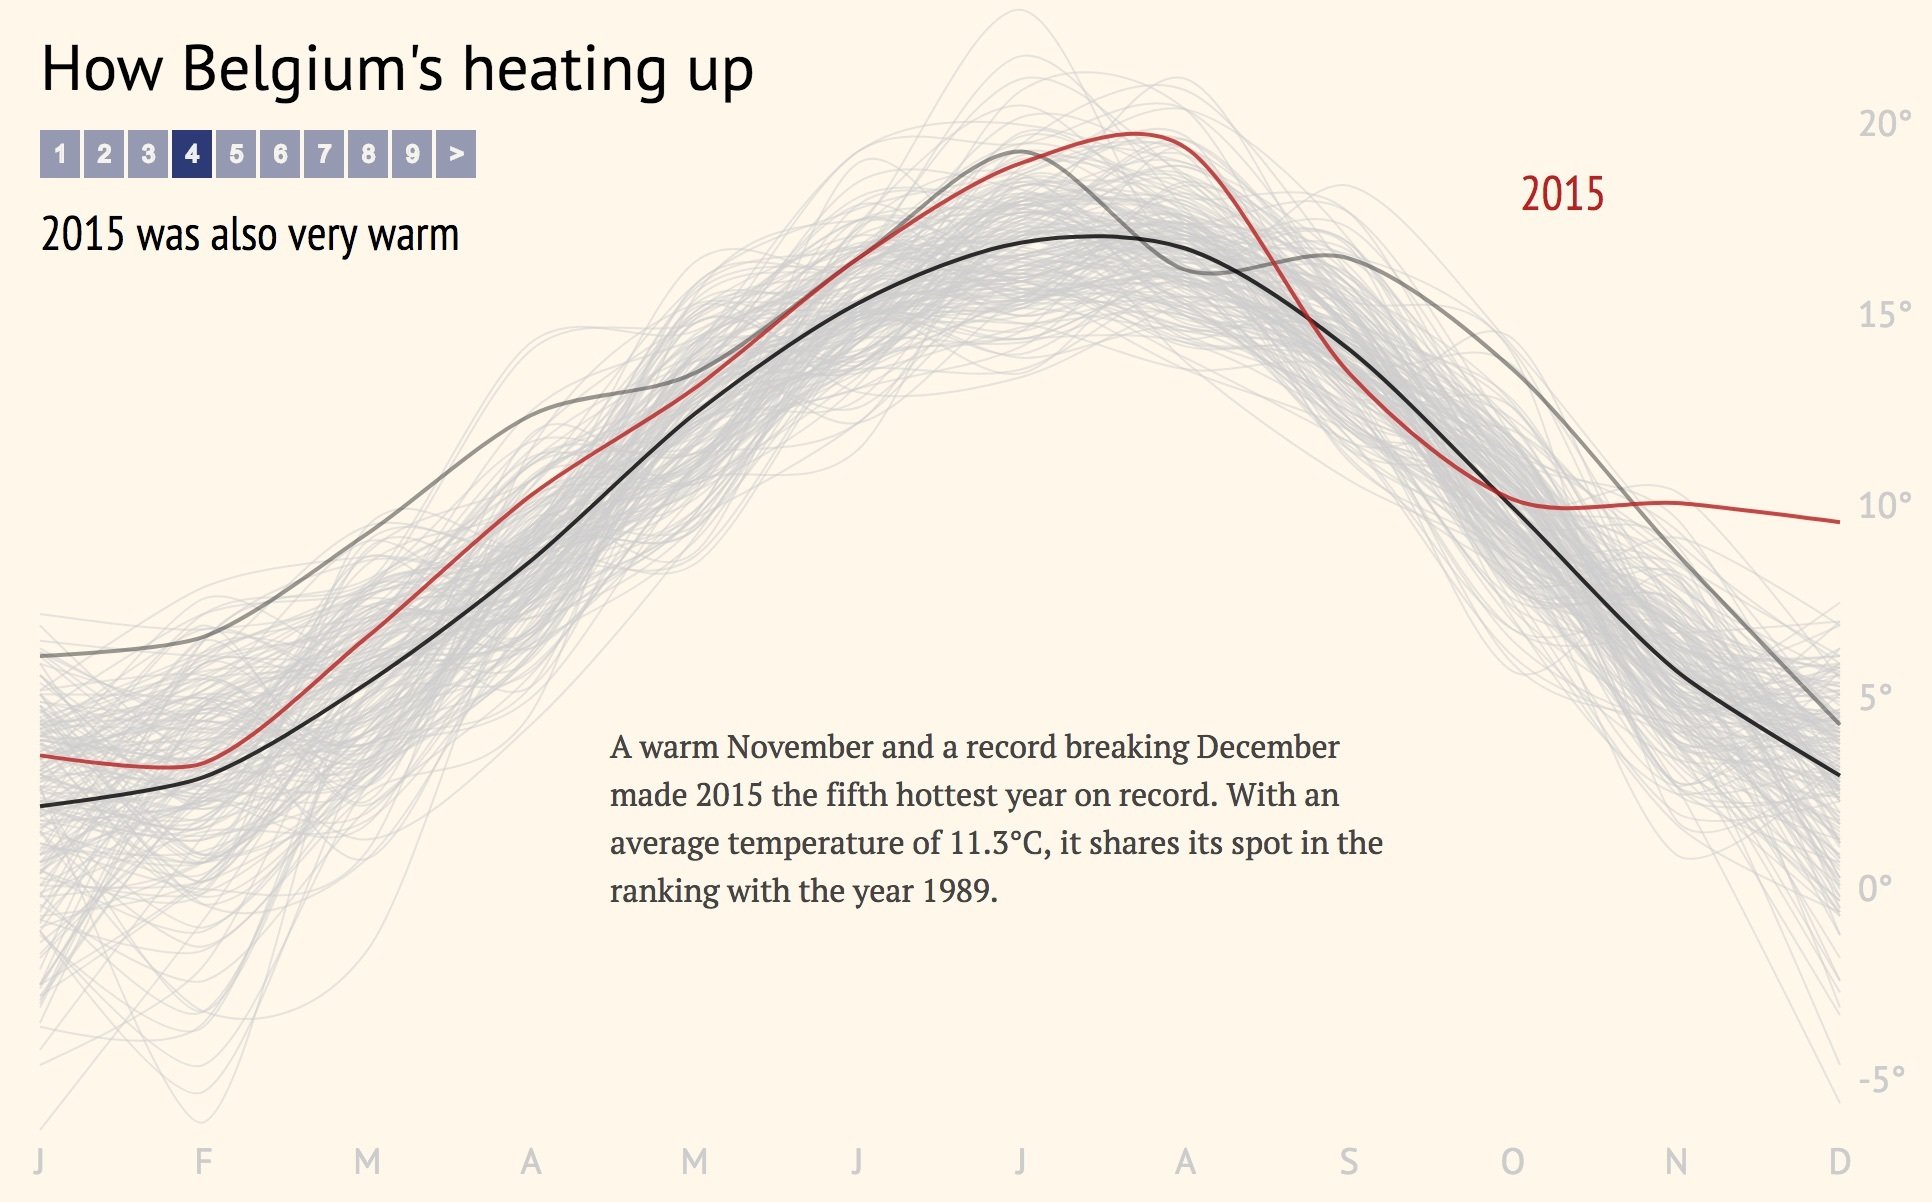
Summer 2014


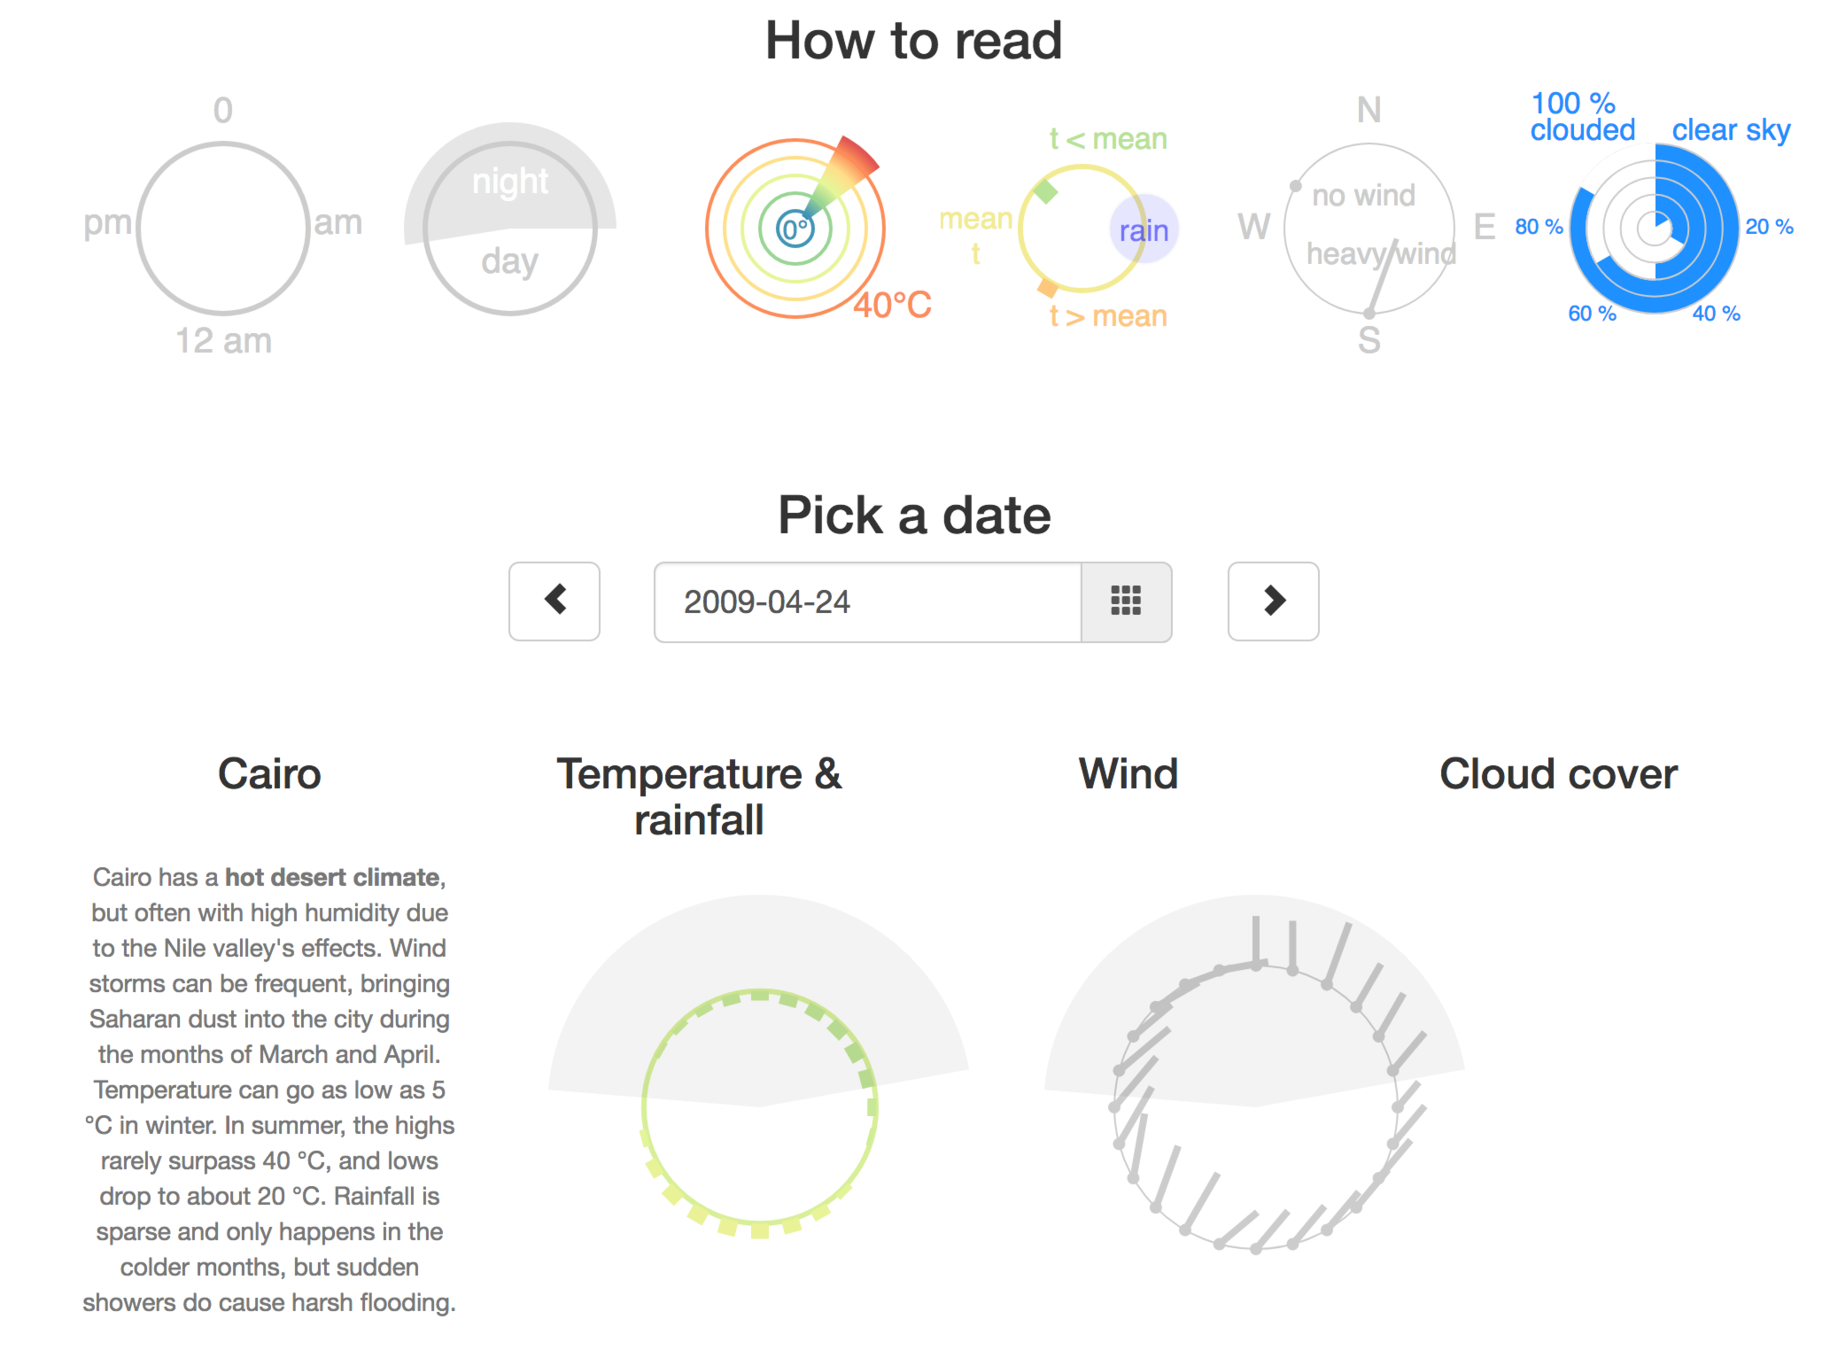
Winter 2014
setwd("~/Sites/ukkel")
read.csv("ukkel_tt.csv", sep=";")
ukkel <- read.csv("ukkel_tt.csv", sep=";")
head(ukkel)
colnames(ukkel) <- c("Jaar","1","2","3","4","5","6","7","8","9","10","11","12")
head(ukkel)
melt <- melt(ukkel, id=c("Jaar"))
library("reshape2", lib.loc="/Library/Frameworks/R.framework/Versions/3.1/Resources/library")
melt <- melt(ukkel, id=c("Jaar"))
head(melt)
colnames(melt) <- c("Jaar", "Maand", "T")
head(melt)
write.csv(melt, "temperature2.csv")
+ the Tidyverse
2016
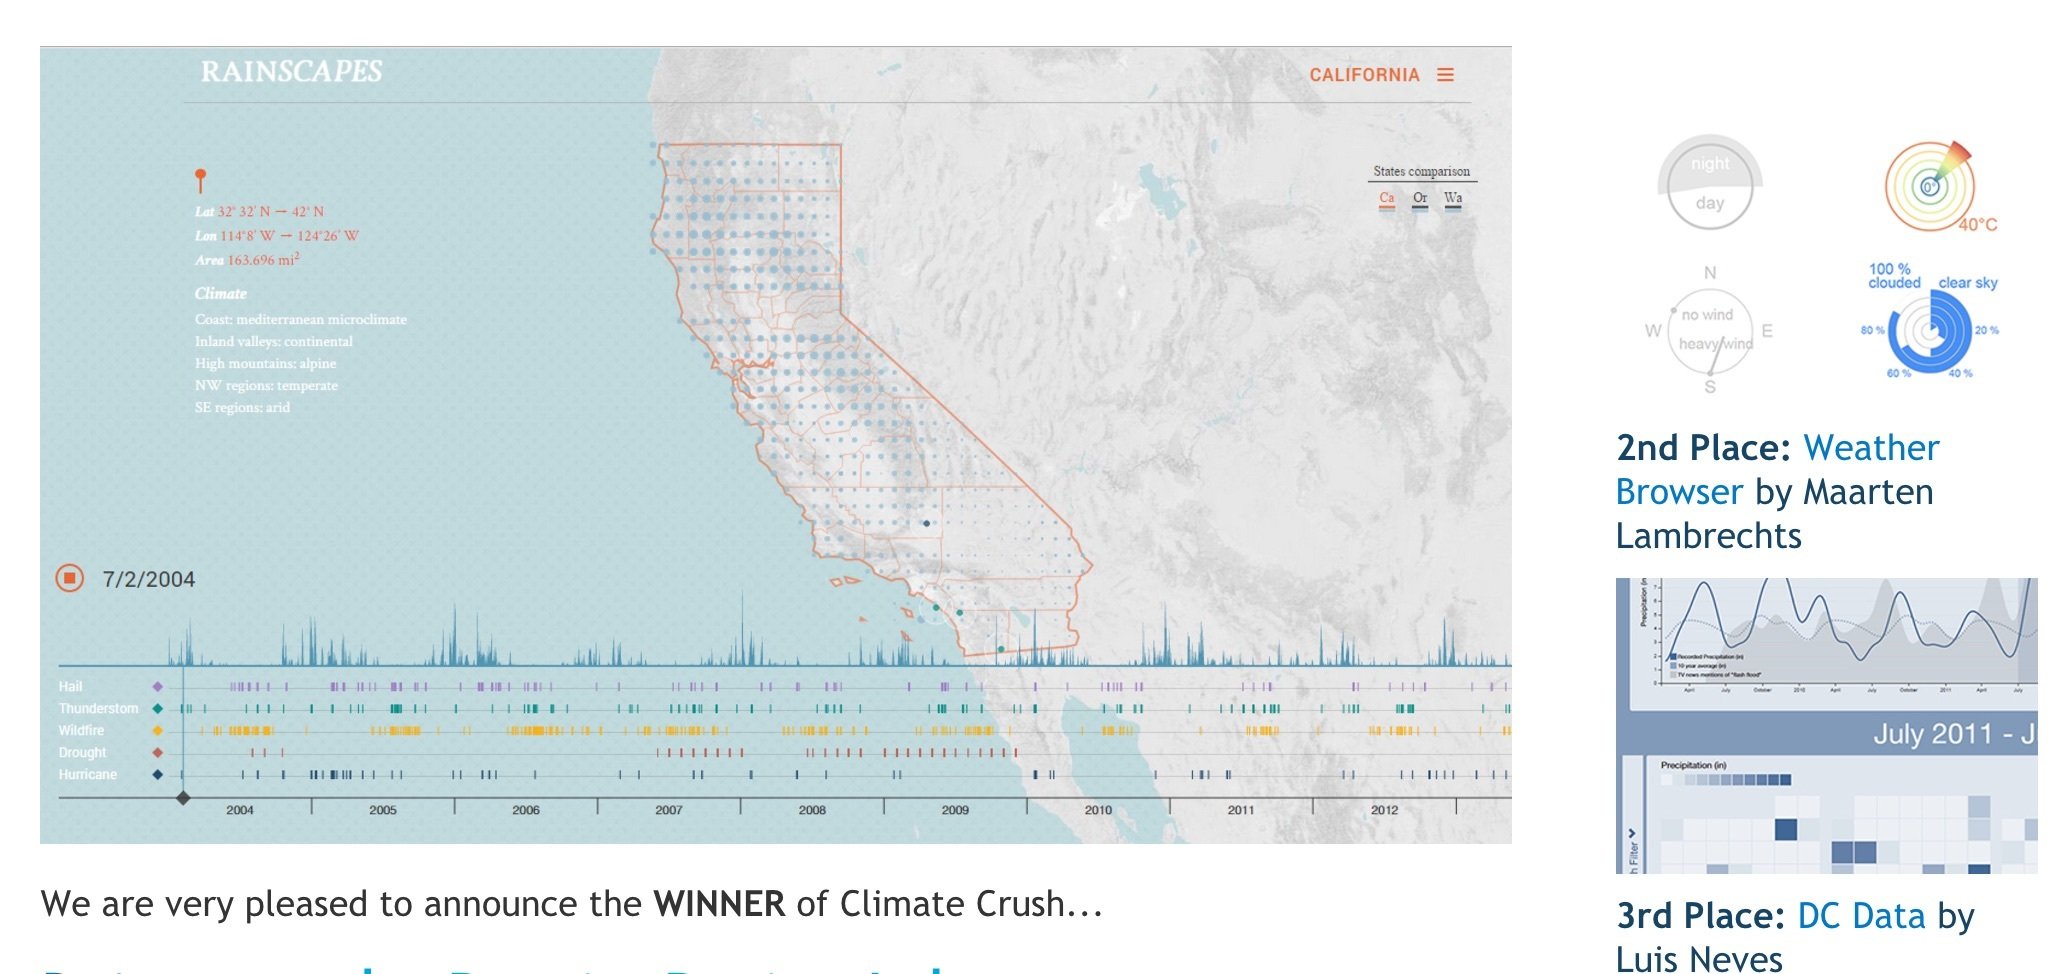
Malofiej Infographic Awards (✝ 2021)
2017

2019
| country | income | life expectancy |
|---|
Html
svg chart
D3
Flubber
d3-
scale
| country | income | life expectancy |
|---|
Html
svg chart
D3
Flubber
d3-scale
d3.scaleLinear()
d3.scaleLog()
Only import functions you need from modules (install them from npm)
| country | income | life expectancy |
|---|
Html
svg chart
D3
Flubber
D3-scale
d3.scaleLinear()
d3.scaleLog()
Bundle and minify for efficiency
(this requires a build step)
Bundle
| country | income | life expectancy |
|---|
Html
svg chart
D3
Flubber
D3-scale
d3.scaleLinear()
d3.scaleLog()
D3 still interacts with the DOM to add elements
Bundle

2020
| country | income | life expectancy |
|---|
Html
svg chart
D3
React
d3-scale
| country | income | life expectancy |
|---|
Html
svg chart
D3
React
d3-scale
React is a framework that controls what elements are rendered and updated (it controls the DOM)
| country | income | life expectancy |
|---|
Html
svg chart
D3
React
d3-scale
d3.scaleLog()
d3.scaleLinear()
But you can still use D3 modules and functions in React
| country | income | life expectancy |
|---|
Html
svg chart
D3
React
d3-scale
d3.scaleLog()
d3.scaleLinear()
D3 scales can calculate the x and y positions, color, size, ... of visual elements
| country | income | life expectancy |
|---|
Html
svg chart
D3
React
d3-scale
d3.scaleLog()
d3.scaleLinear()
But in the end, it is React that adds these elements to the page, and interacts with them
| country | income | life expectancy |
|---|
Html
svg chart
D3
React
d3-scale
d3.scaleLog()
d3.scaleLinear()
This means that you loose the the things D3 can do with elements, like transition properties
<svg width={width} height={height}>
    <g className="bubbles-g">
        {countries.map((d) => { // For each item in the countries array, a circle is returned
            return (
                <circle
                  key={"bubble-" + d.Country}
                  cx={xScale(d.coosshare)} //All the scales are d3 scales
                  cy={yScale(d.bmpshare)}
                  r={sizeScale(d.total)}
                  fill={colorScale(d.Region)}
                  stroke={
                    activeCountry === ""
                      ? highlightcountries.length === 0
                        ? "white"
                        : highlightcountries.includes(d.Country)
                        ? "black"
                        : "white"
                      : d.Country === activeCountry
                      ? "black"
                      : "white"
                  }
                  strokeWidth={...}
                  style={{ cursor: "pointer" }}
                  opacity={...}
                  onMouseOver={() => {//Show tooltip}}
                  onMouseLeave={() => {//Hide tooltip}}
                ></circle>
    </g>
</svg>
React & svg

2021
| country | income | life expectancy |
|---|
Html
svg chart
D3
Svelte
d3-scale
| country | income | life expectancy |
|---|
Html
svg chart
D3
Svelte
d3-scale
Svelte is a frontend framework, like React. It also controls the DOM
| country | income | life expectancy |
|---|
Html
svg chart
D3
Svelte
d3-scale
You can import and use D3 modules to calculate properties of elements, Svelte adds them to the document
| country | income | life expectancy |
|---|
Html
svg chart
D3
Svelte
d3-scale
But Svelte has built in functions for dataviz, like animation and measuring parent container dimensions
svelte/motion
| country | income | life expectancy |
|---|
Html
svg chart
D3
Svelte
d3-scale
But most importantly, on build time, Svelte compiles to just Javascript, and "disappears". Small bundle size, runs fast
svelte/motion
Bundle
Svelte (imo)
All advantages of frameworks (reusable components, reactivity), without the drawbacks (no complicated syntax, no big bundle size, no plugins needed for viz things like animations)