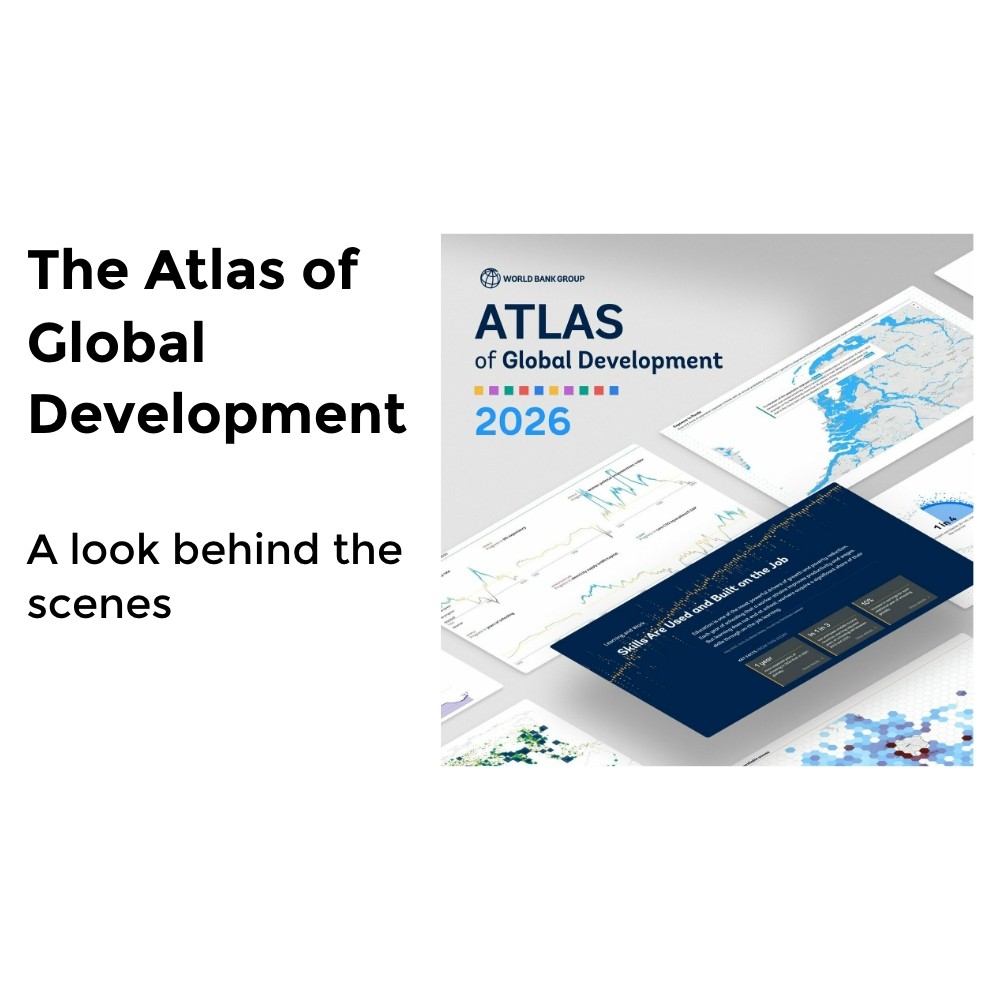
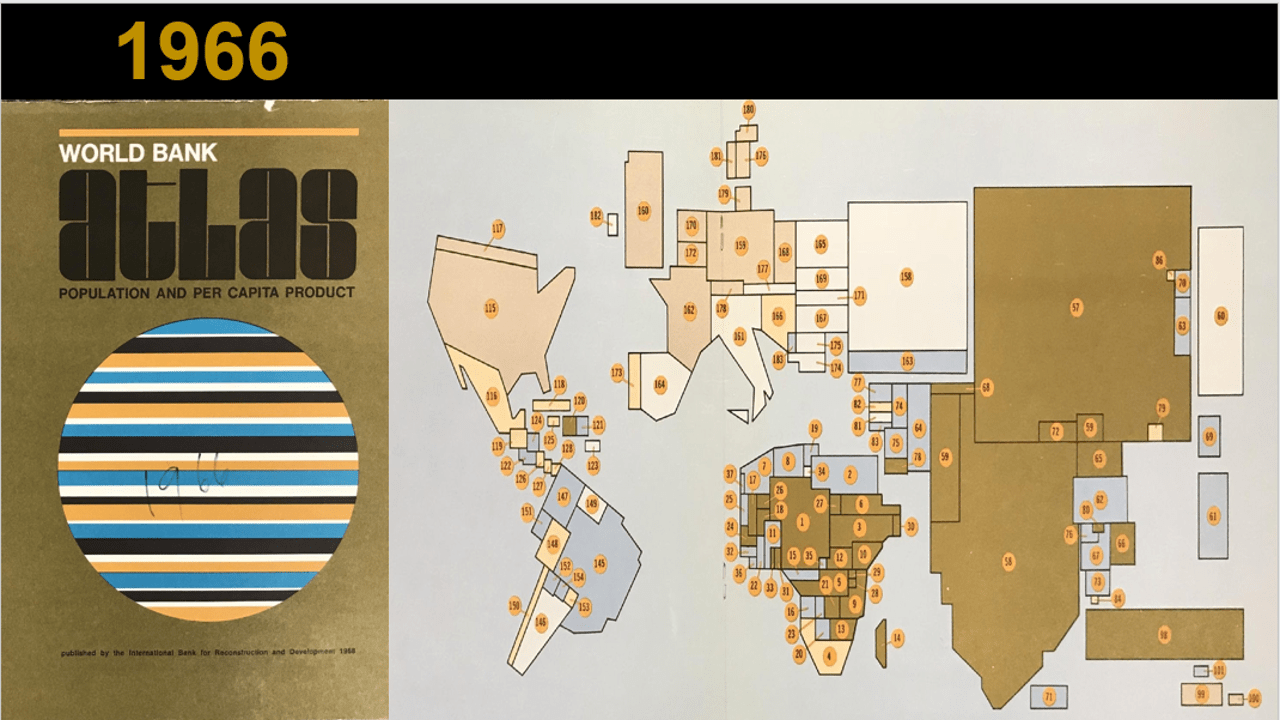
Measuring progress
& communicating global trends
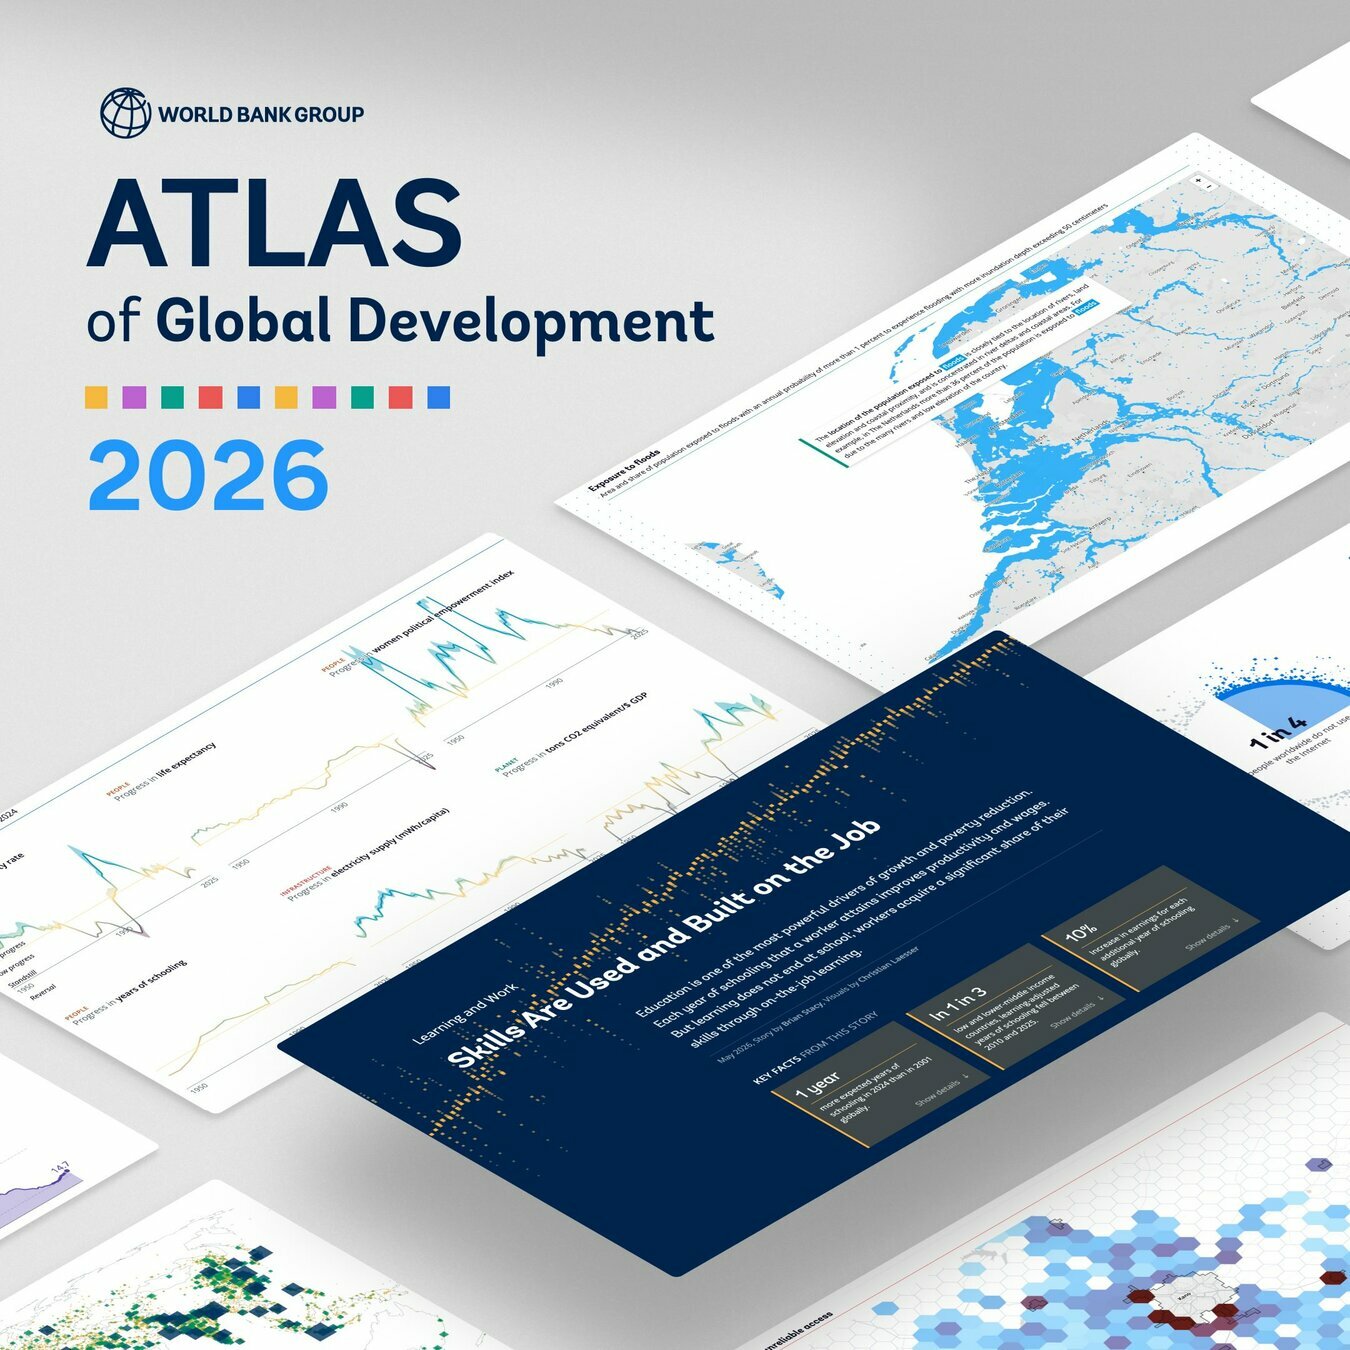
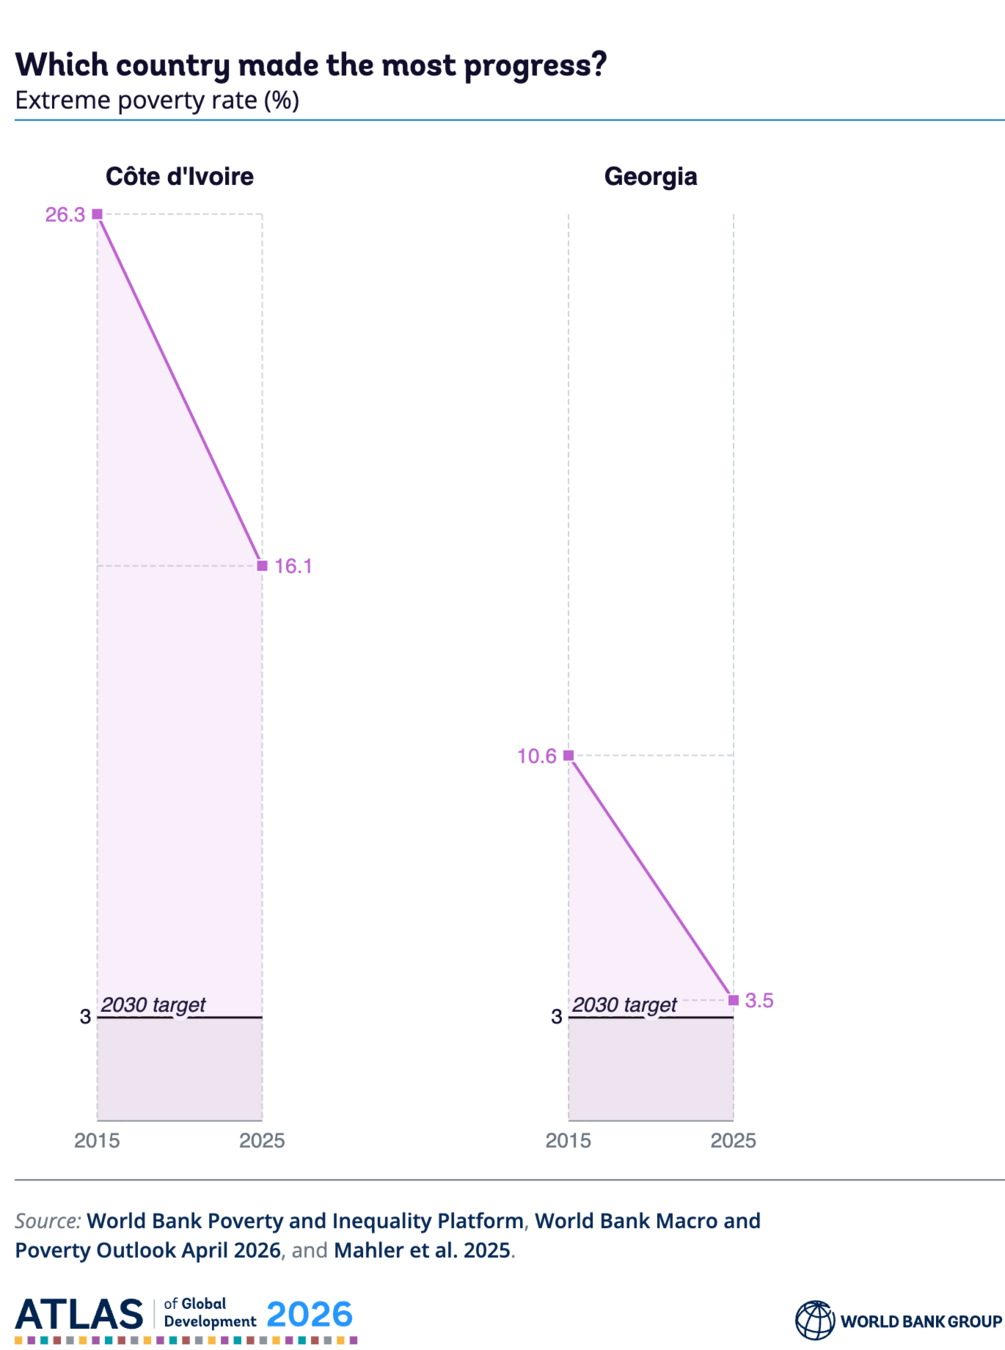
16.1%
Share of population living on less than $3 per day in Côte d'Ivoire, 2025
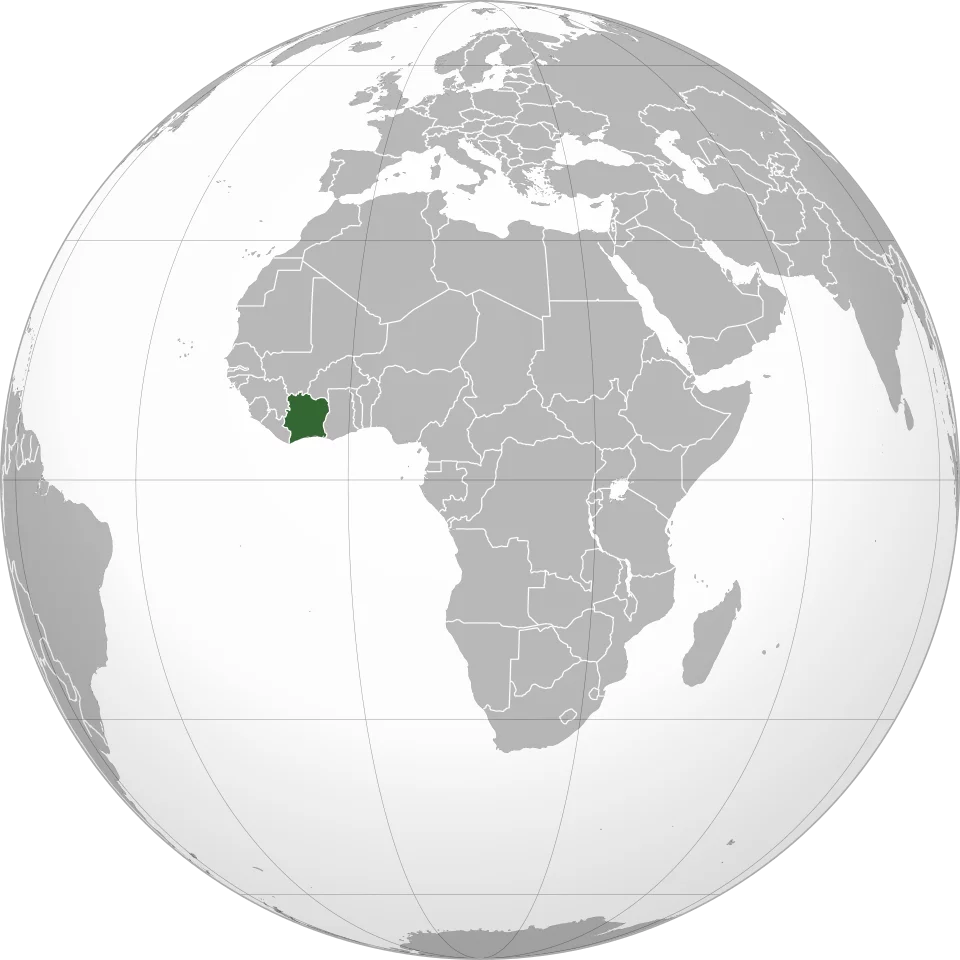
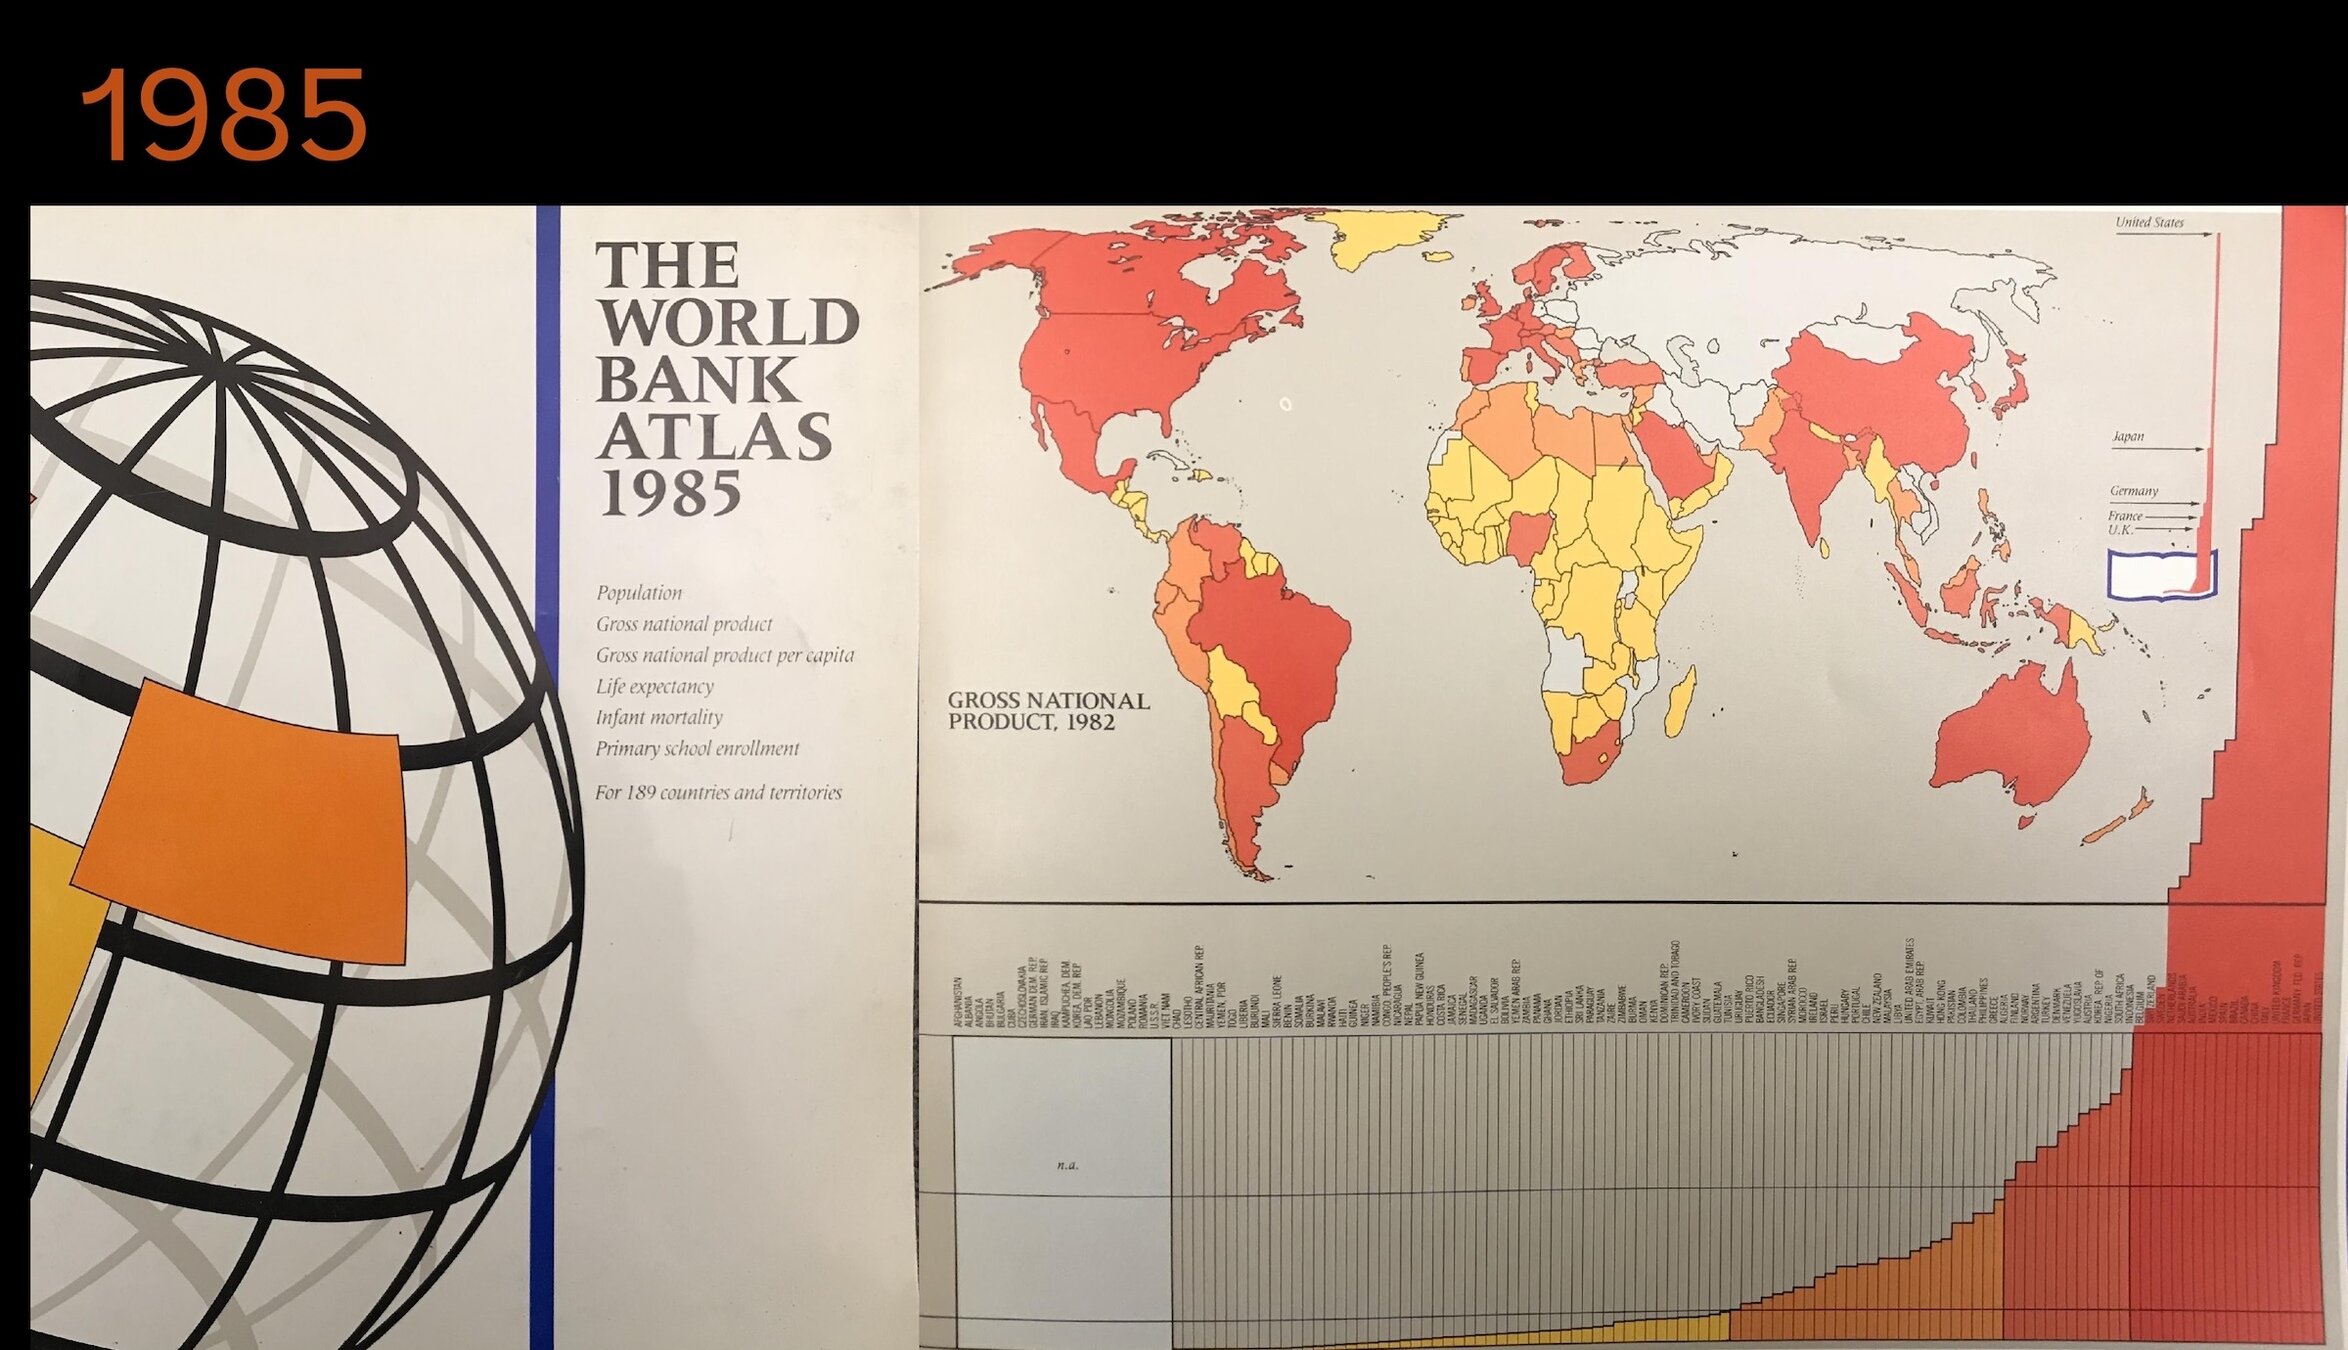
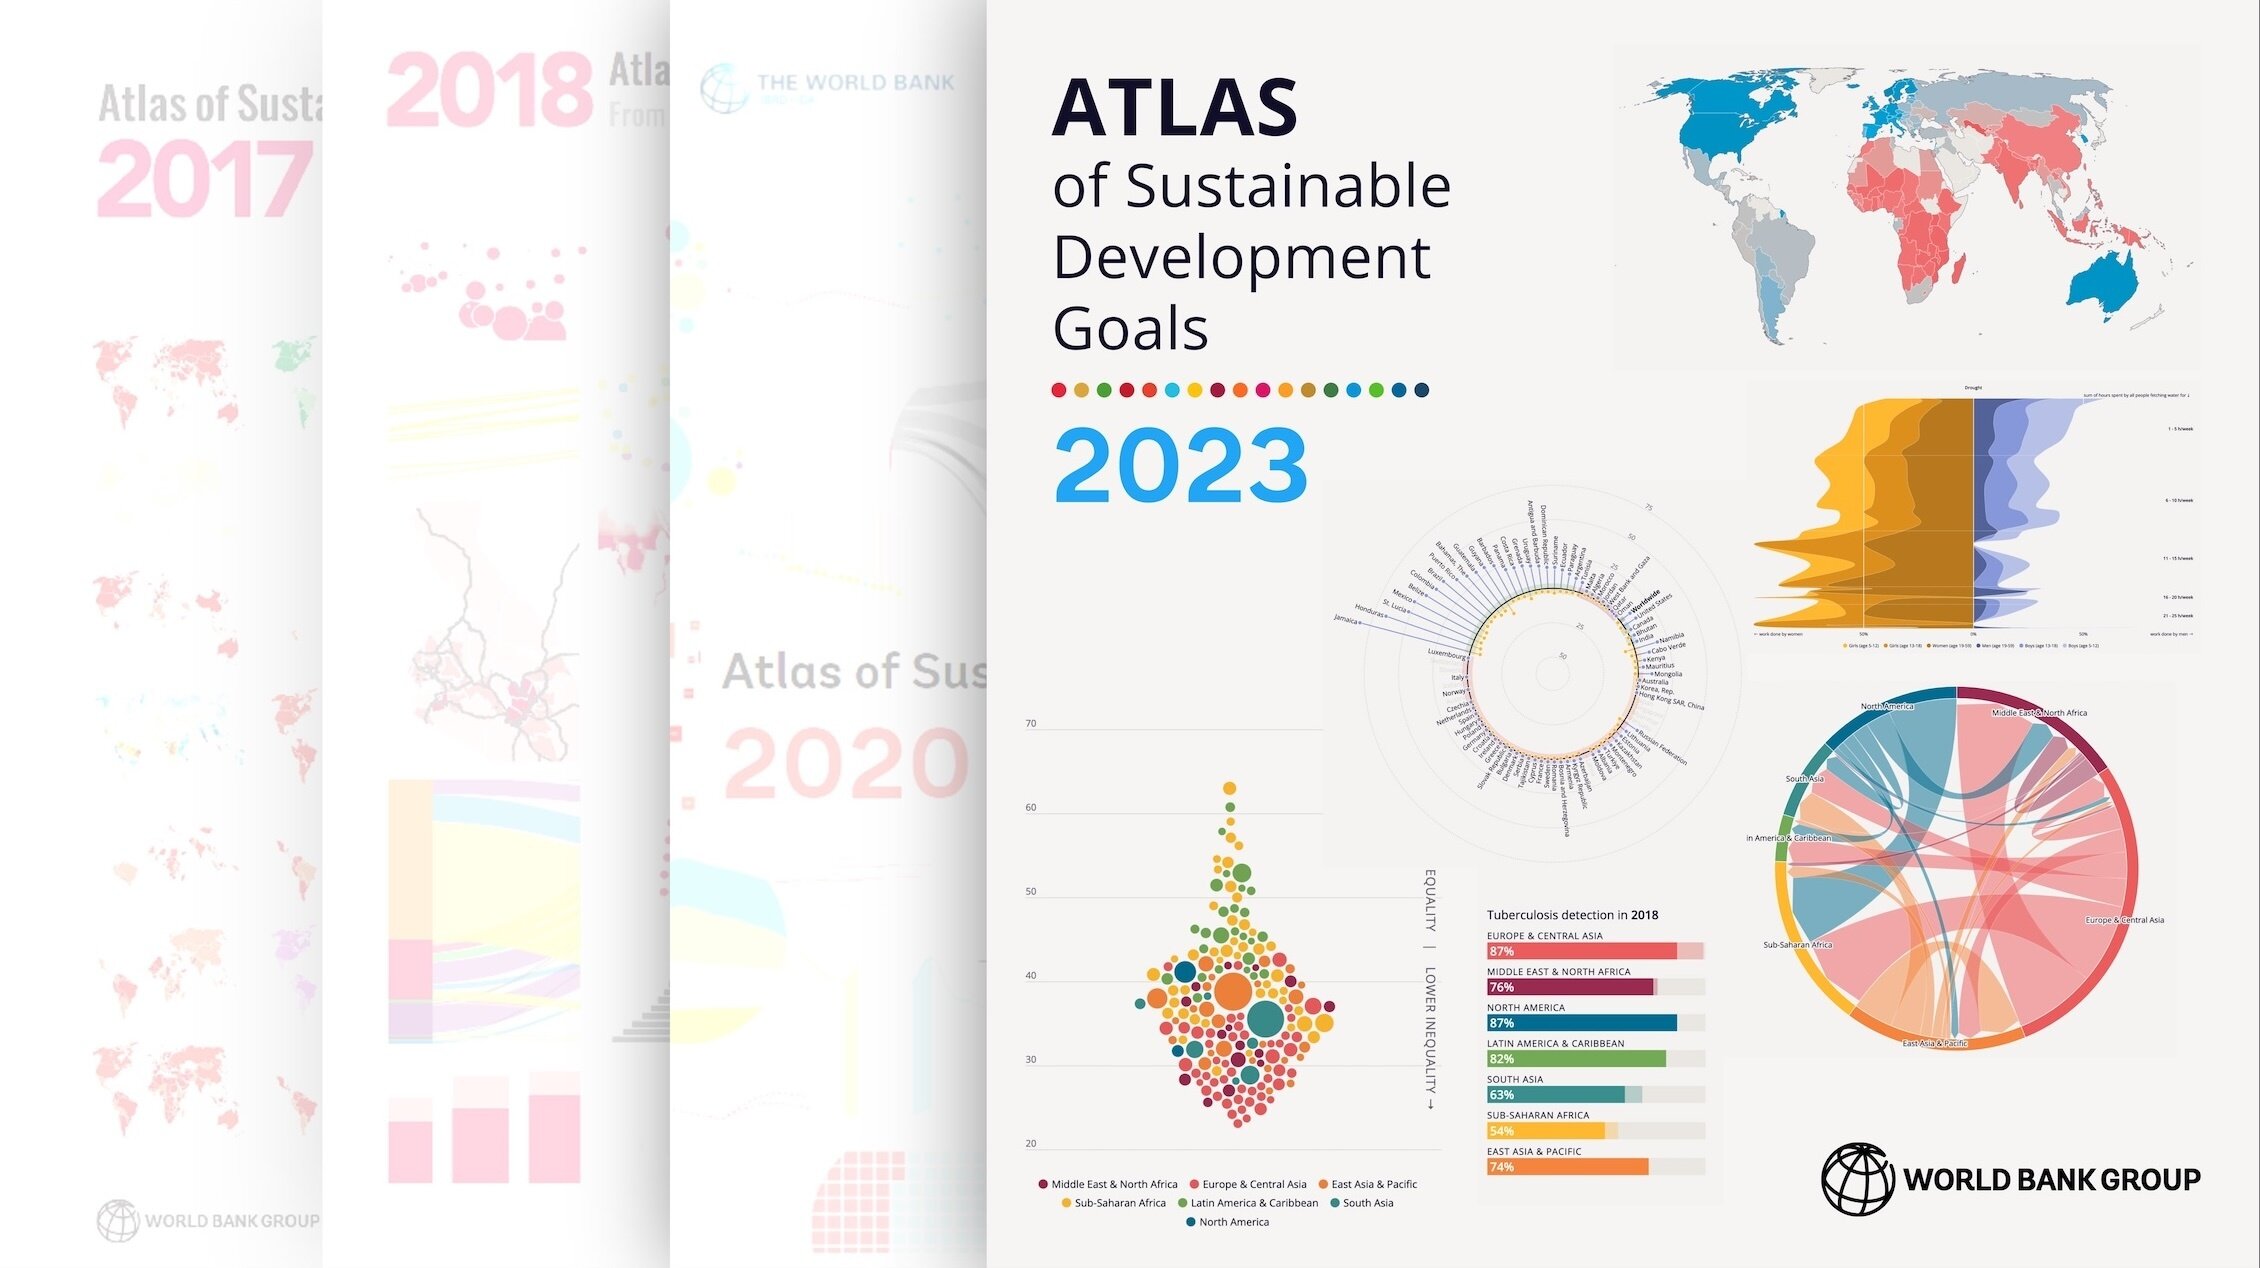
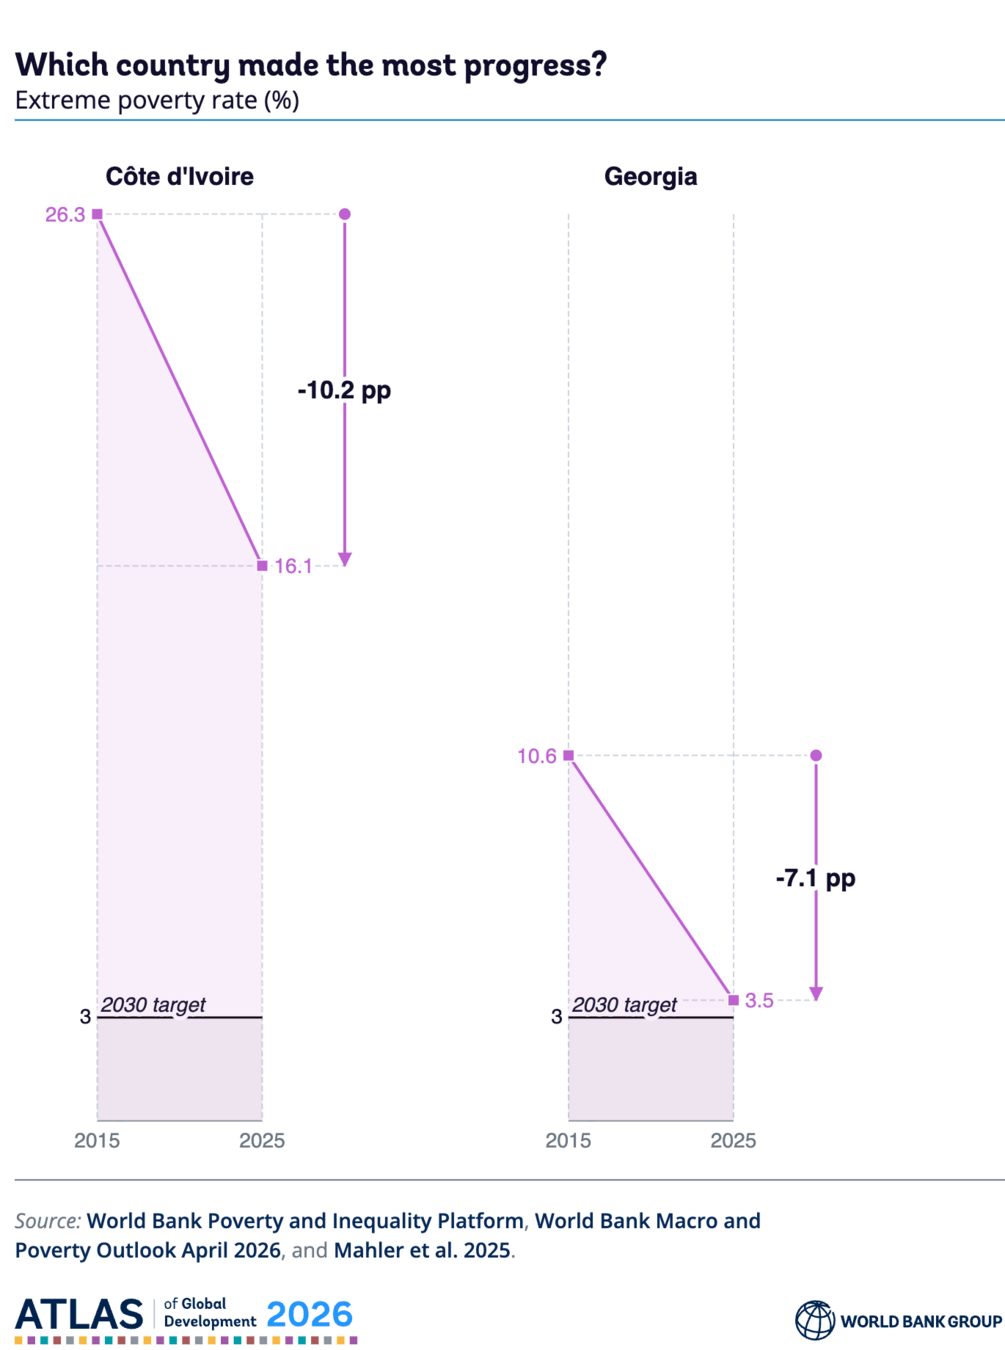
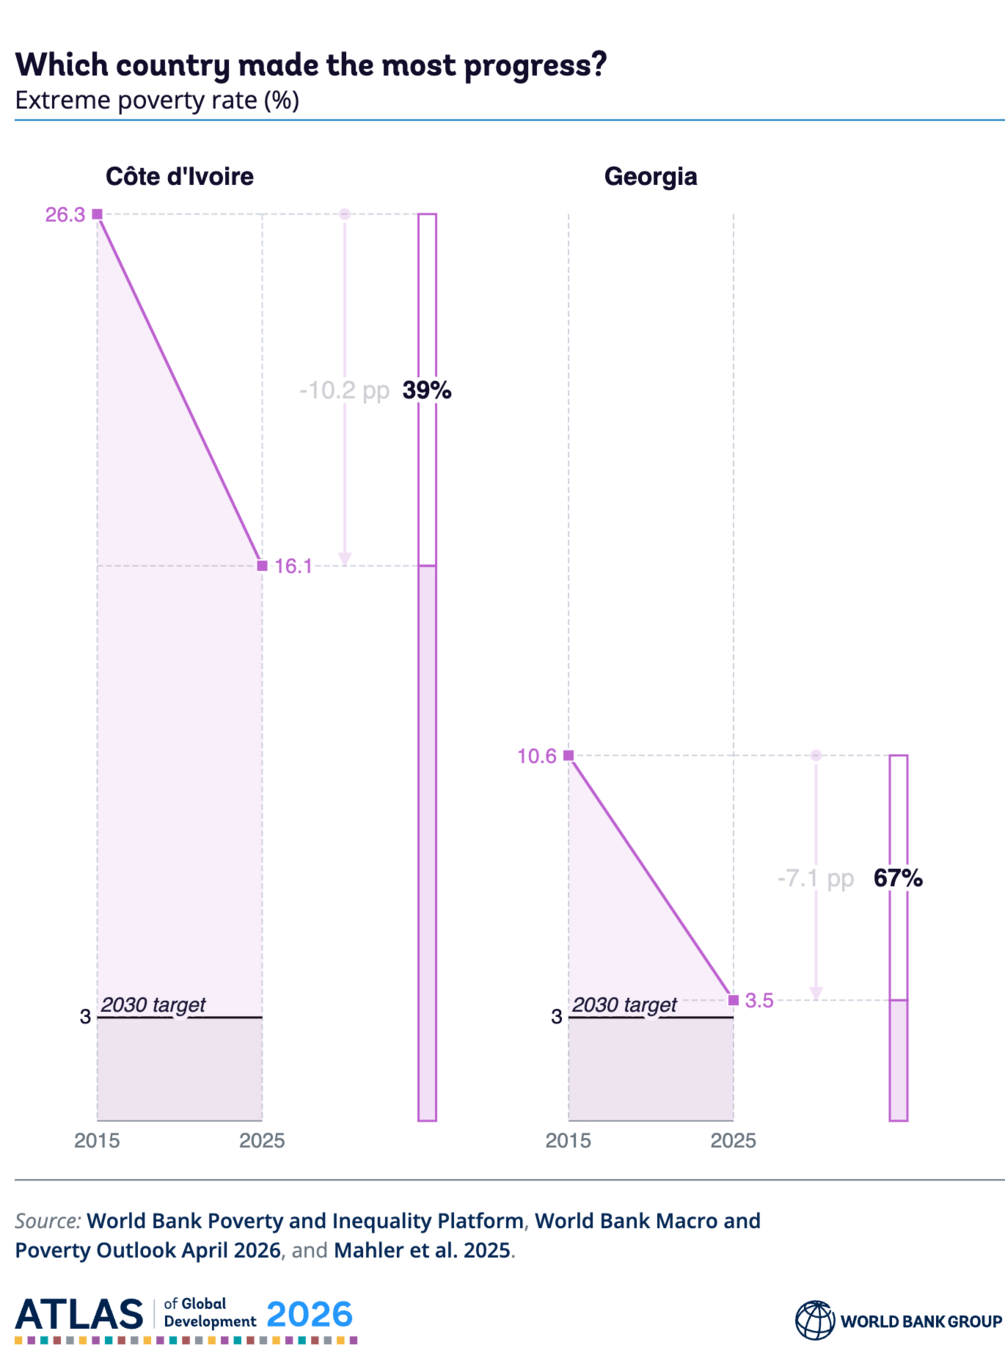
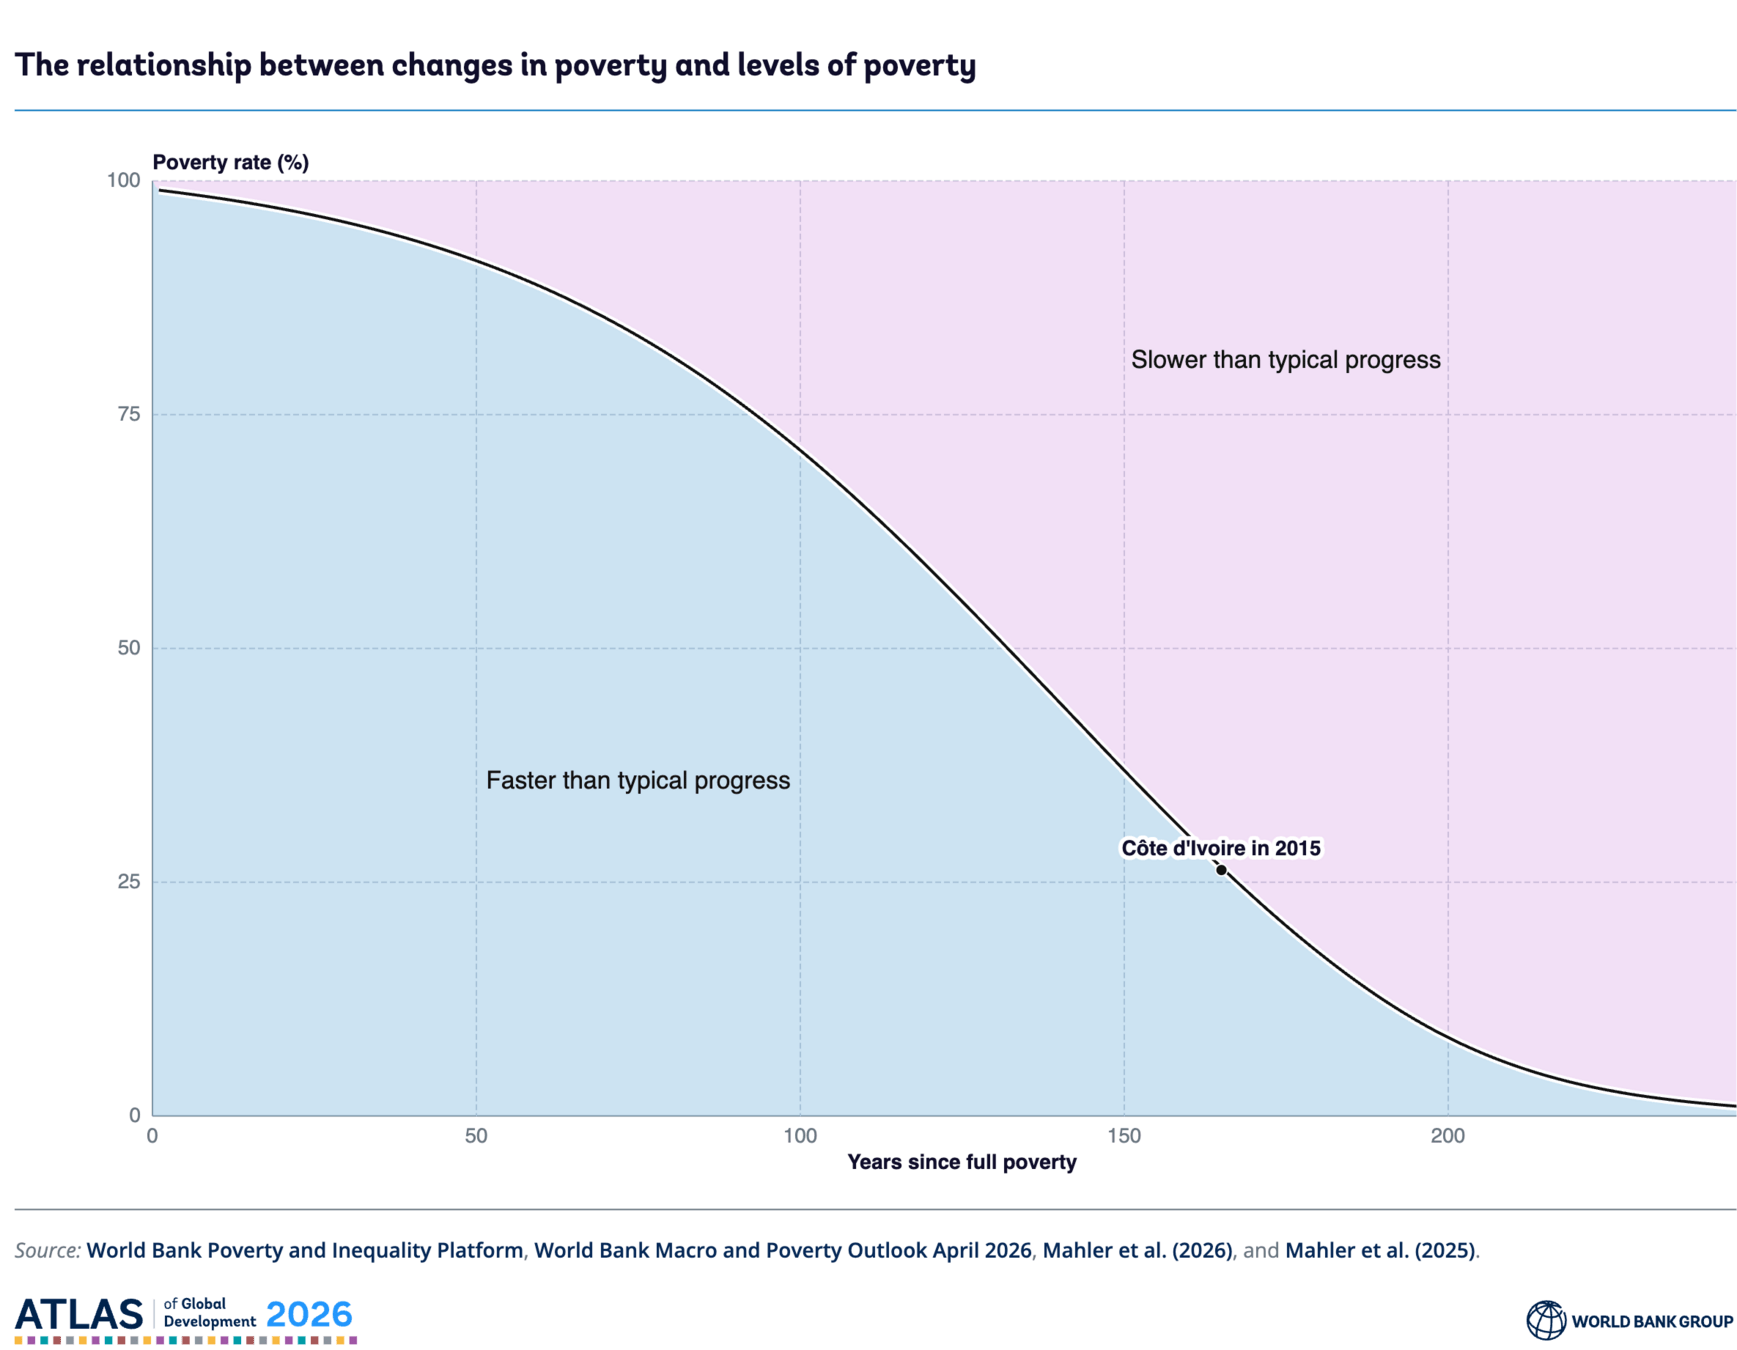
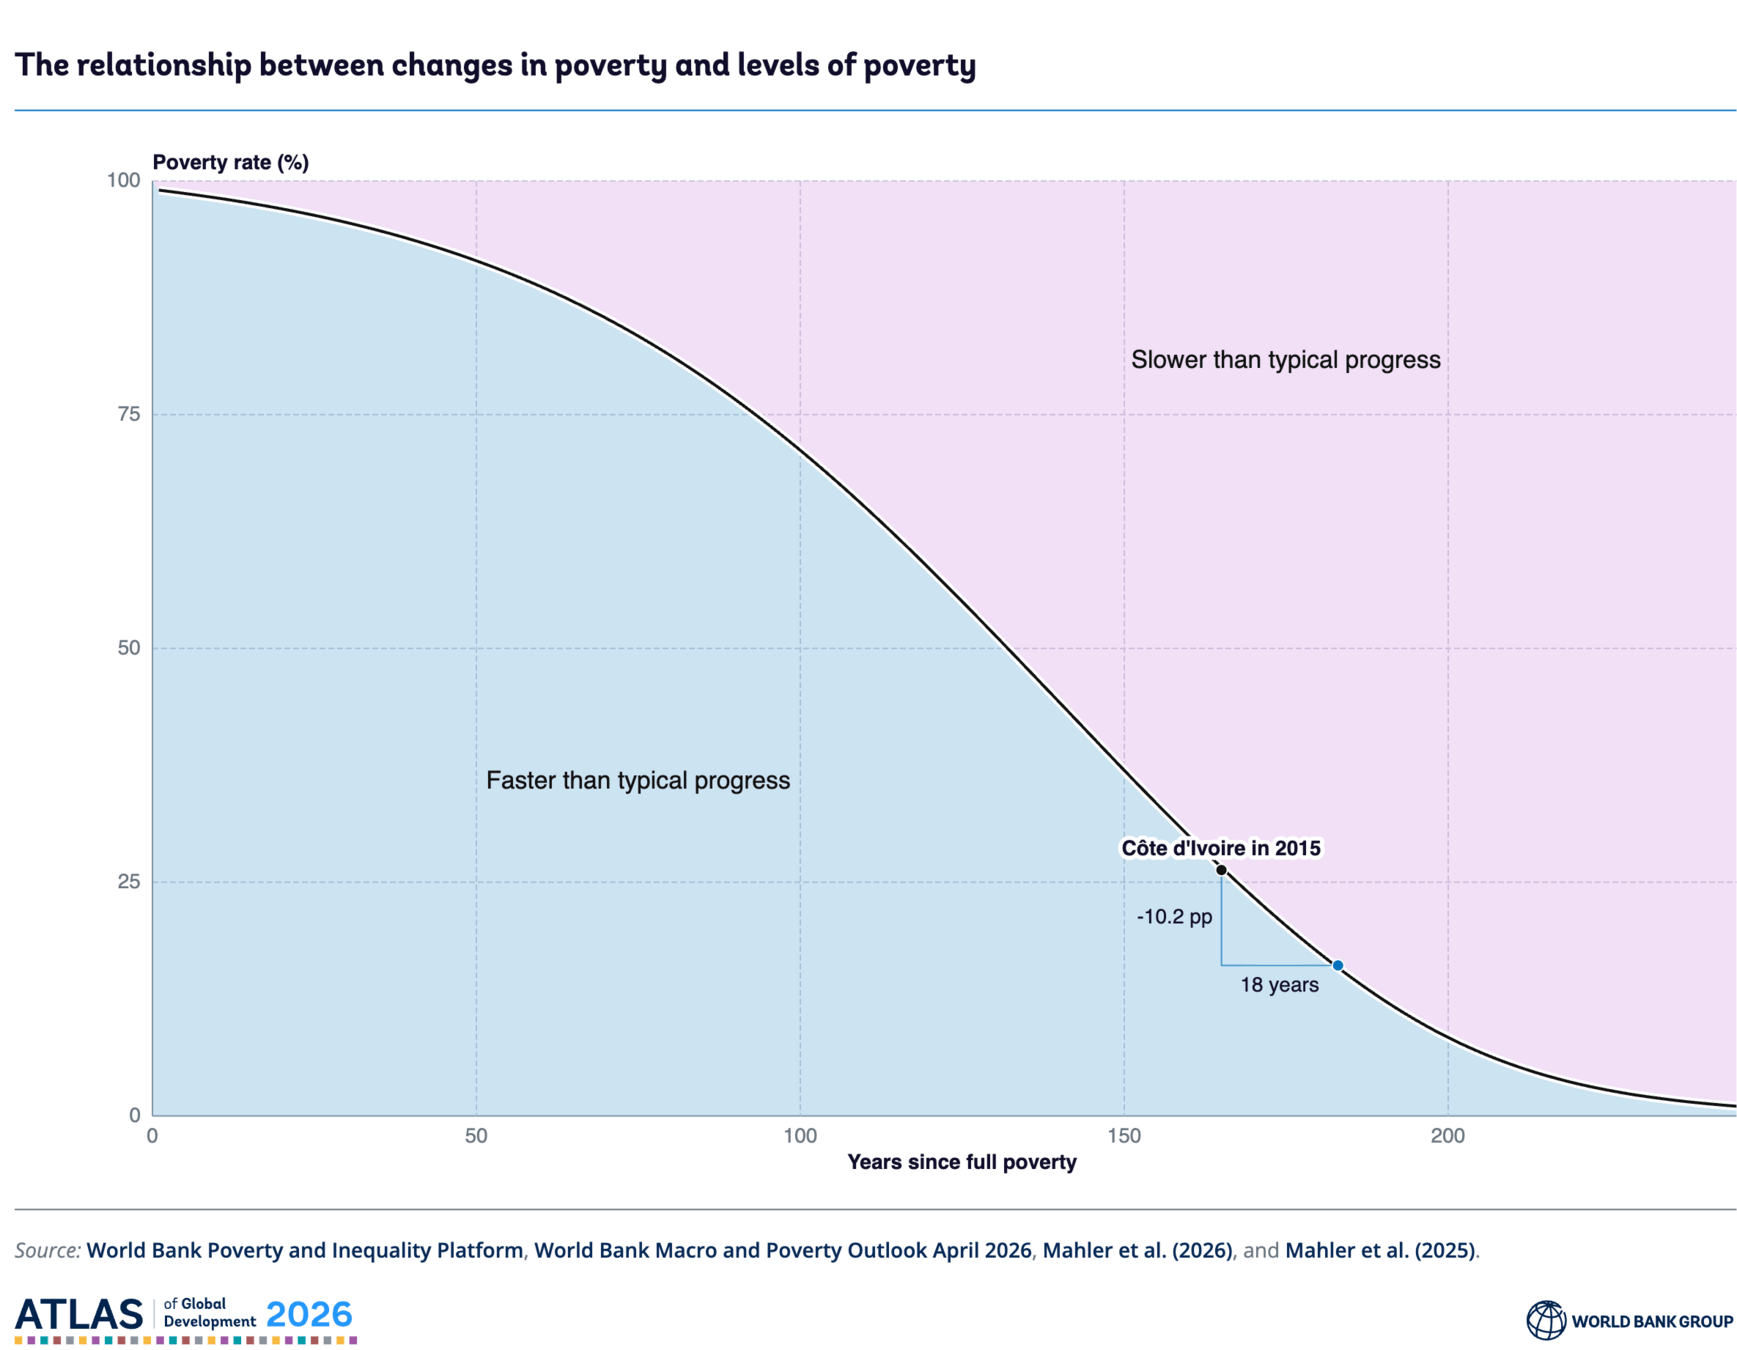
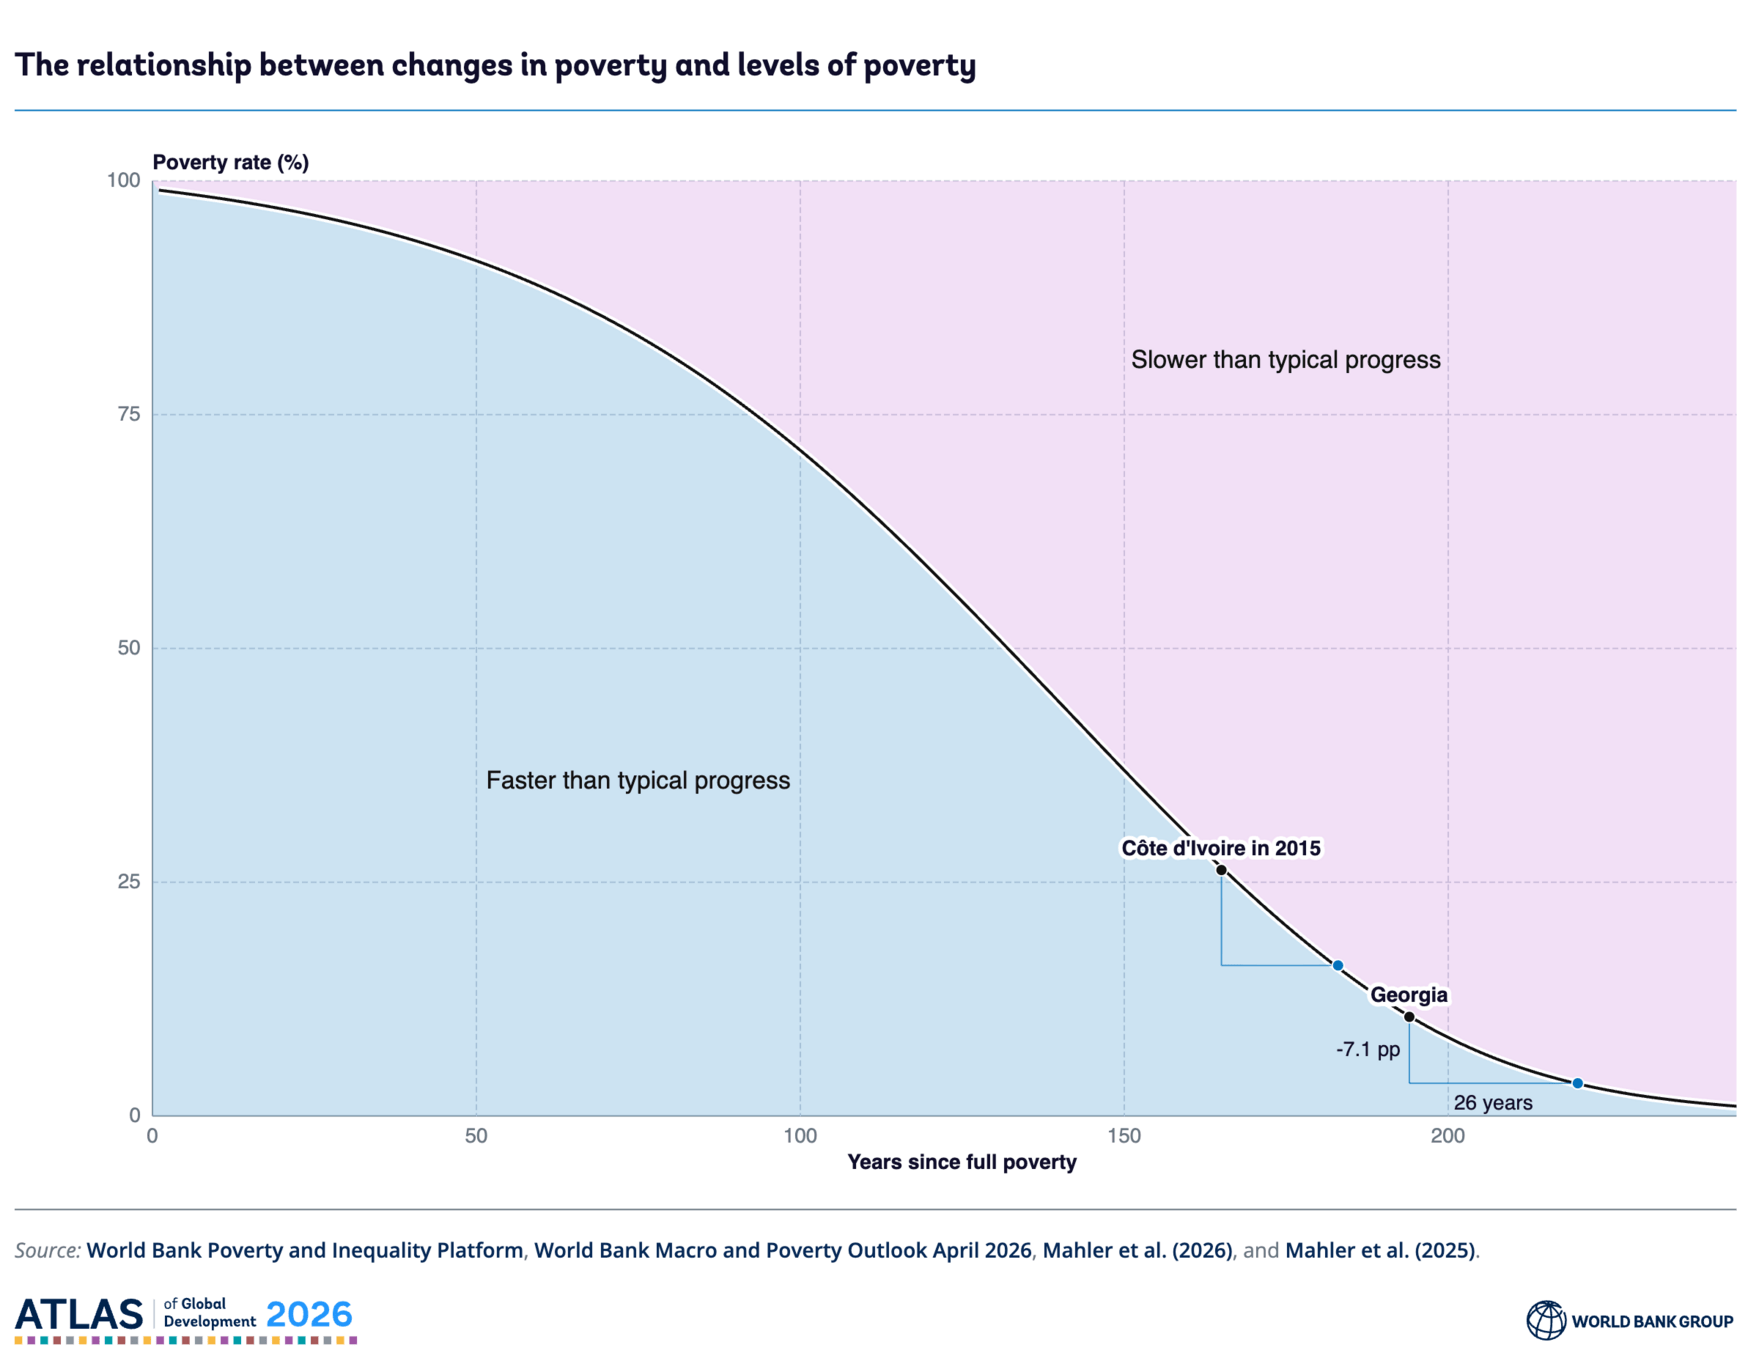
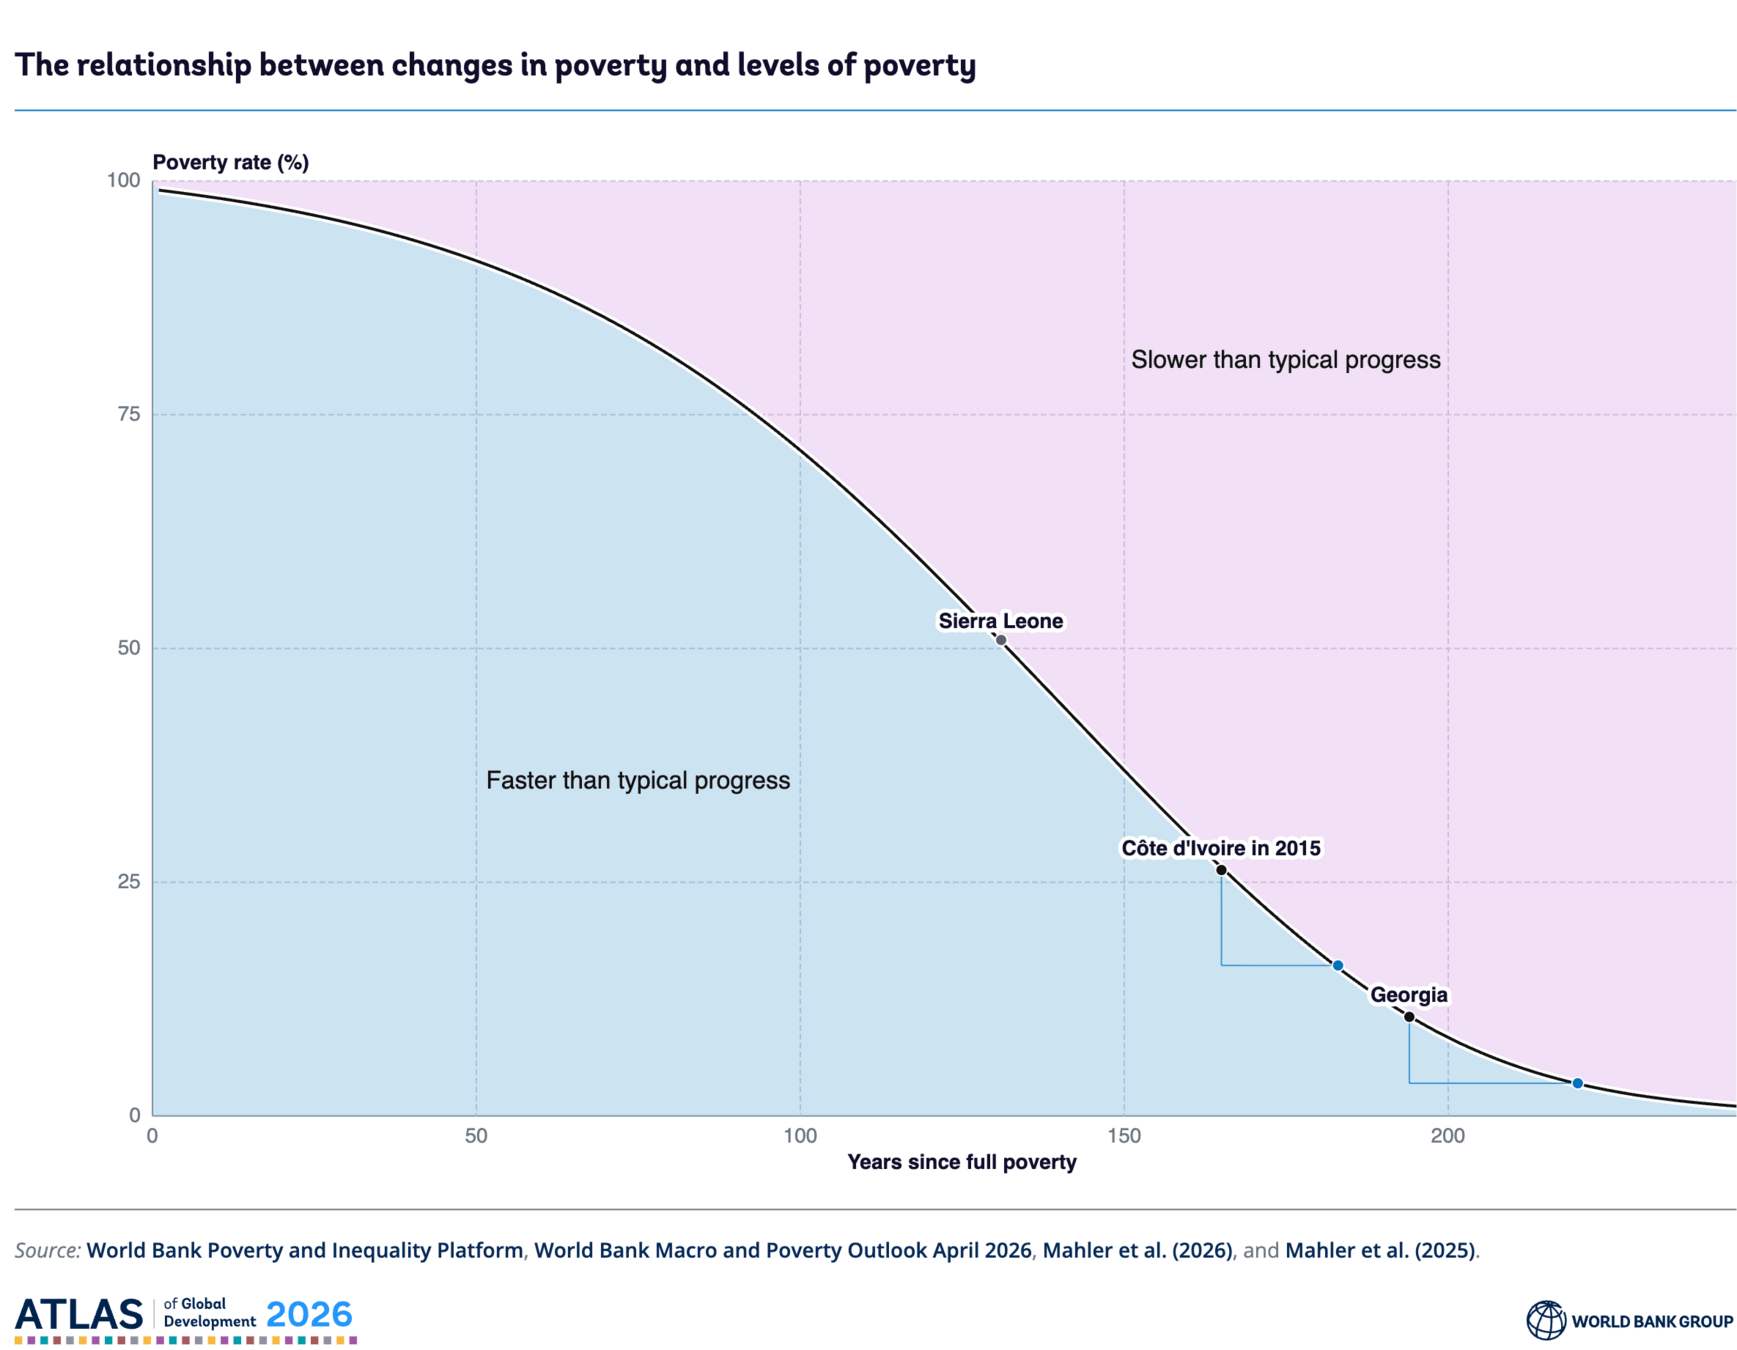
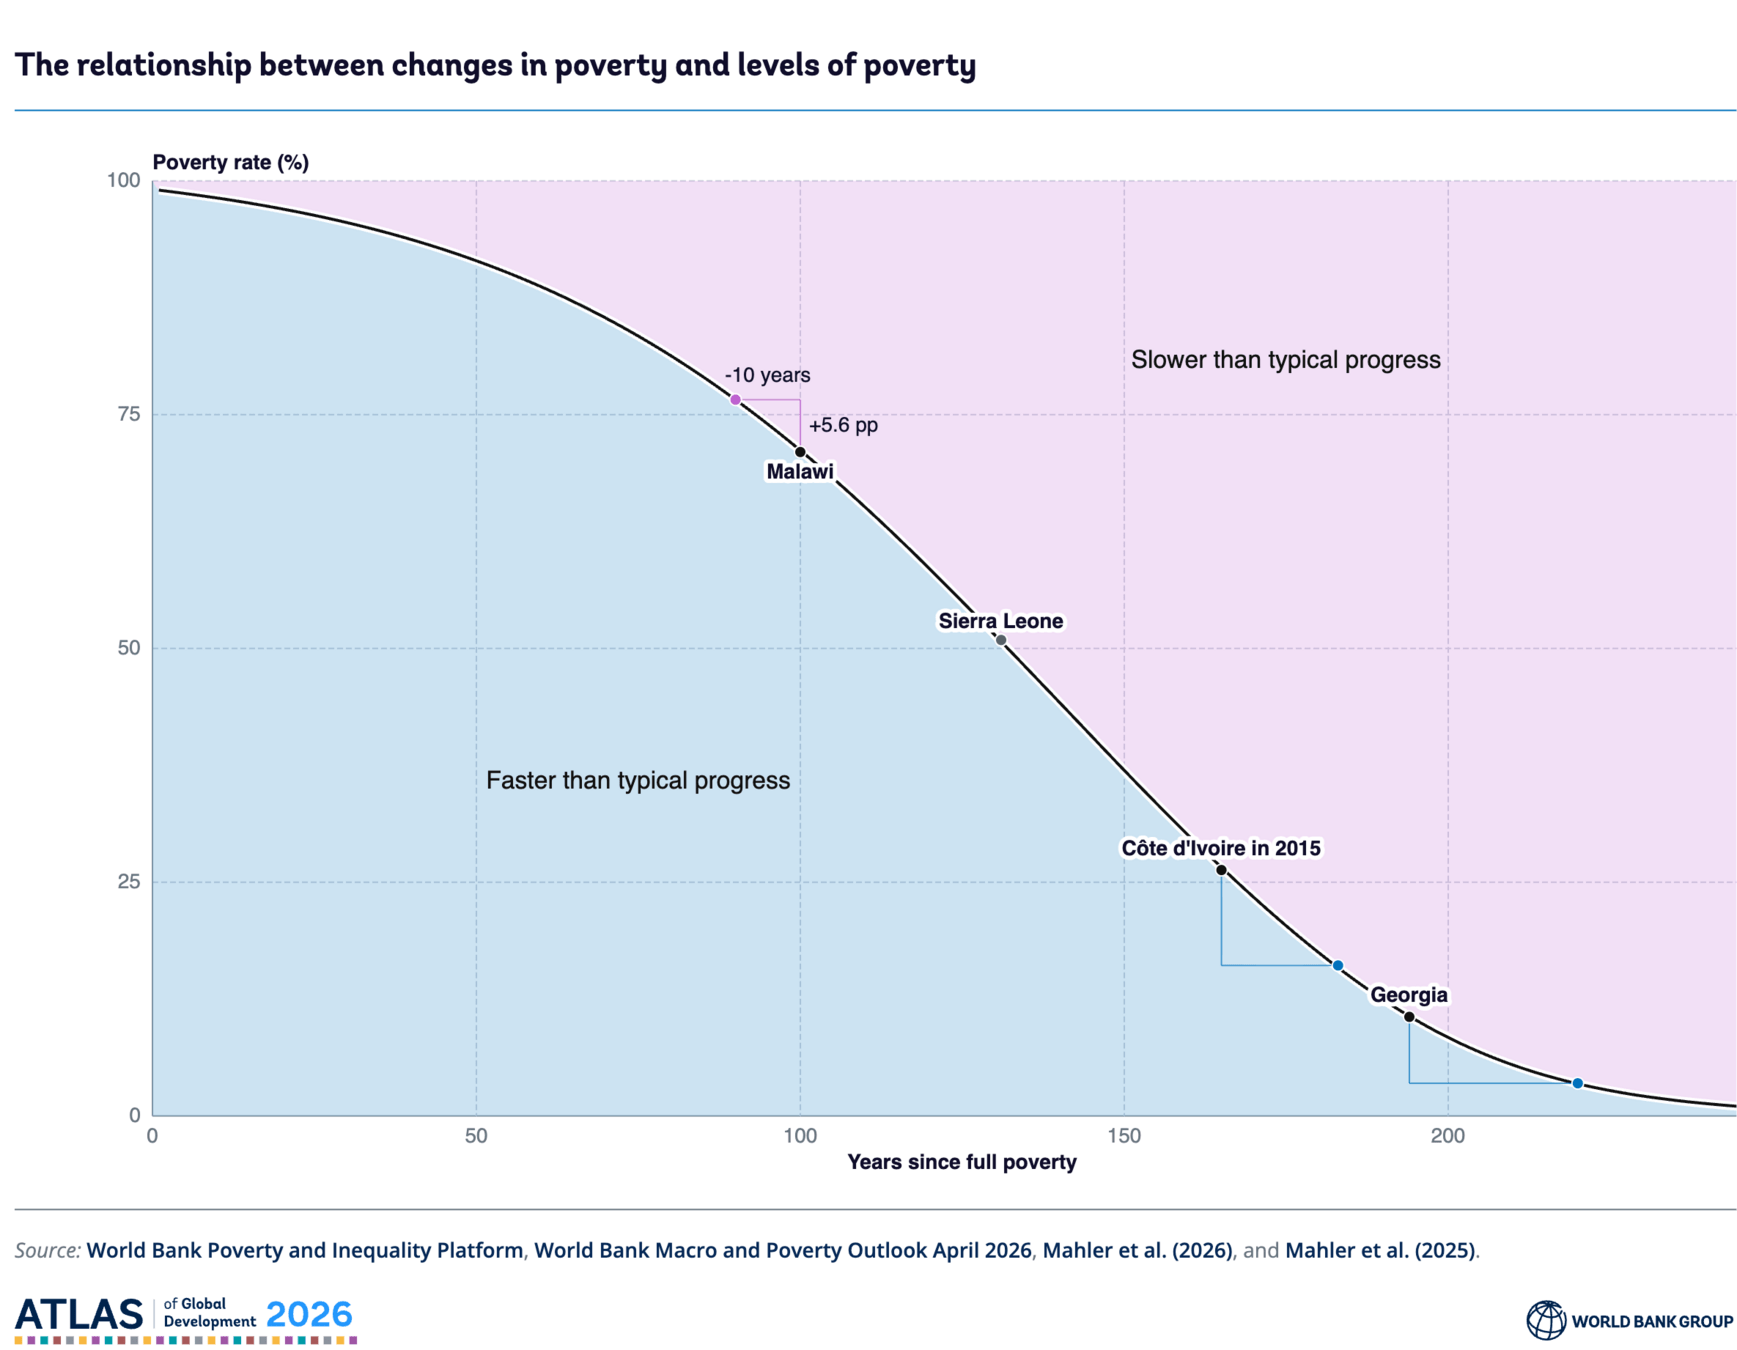
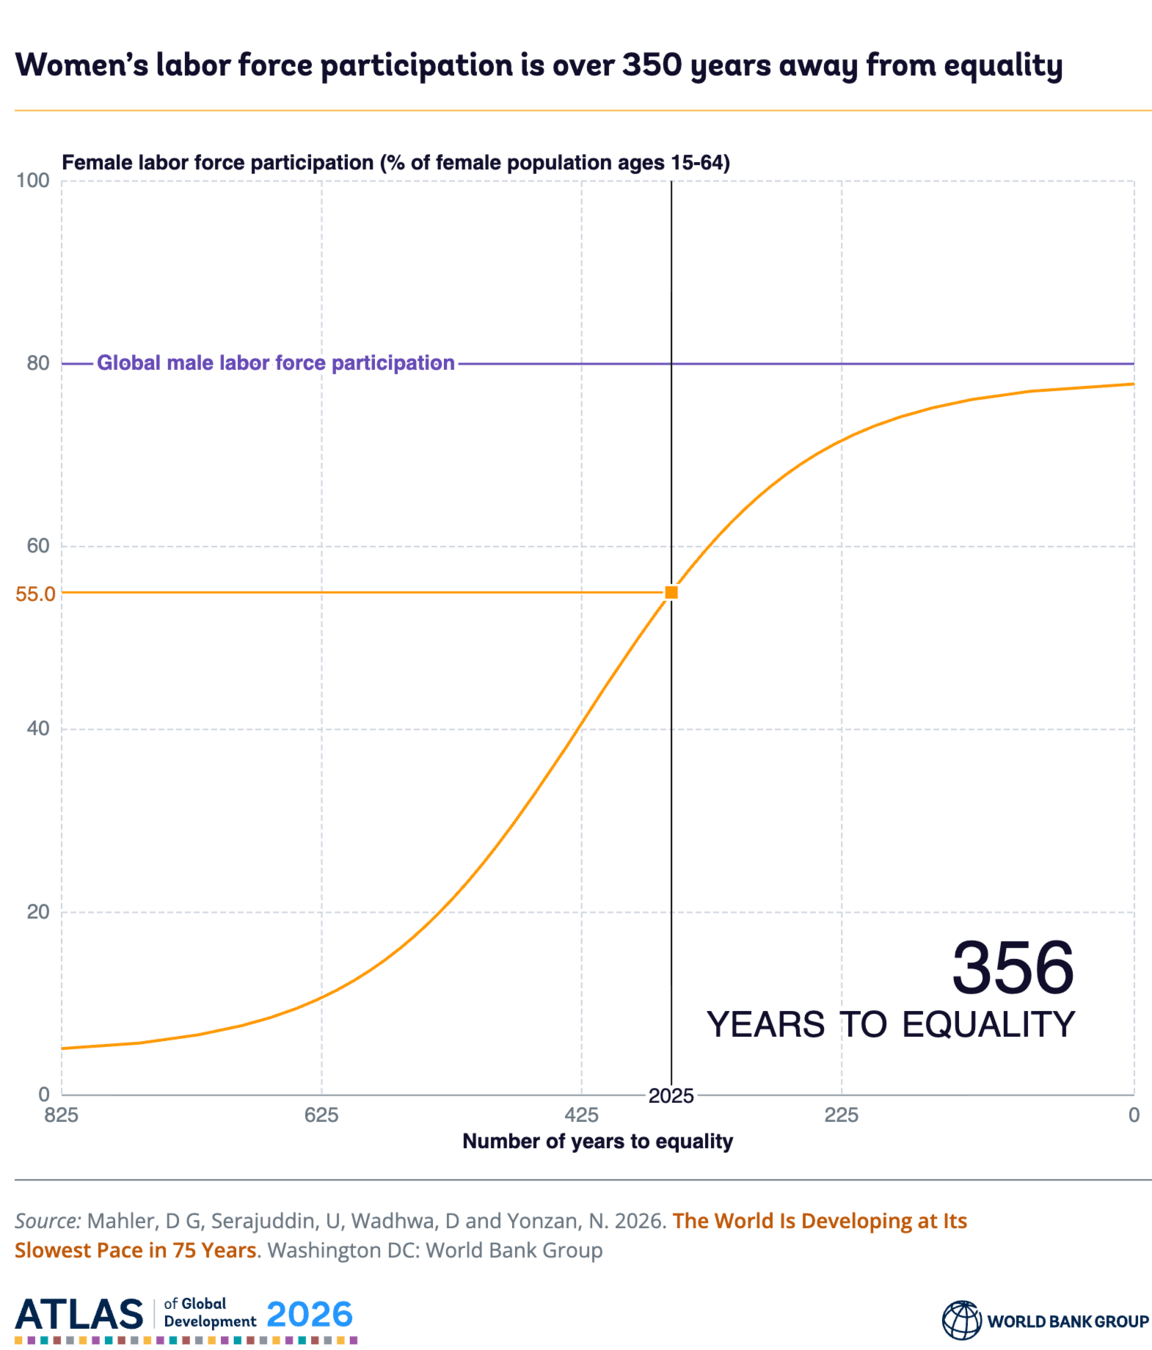
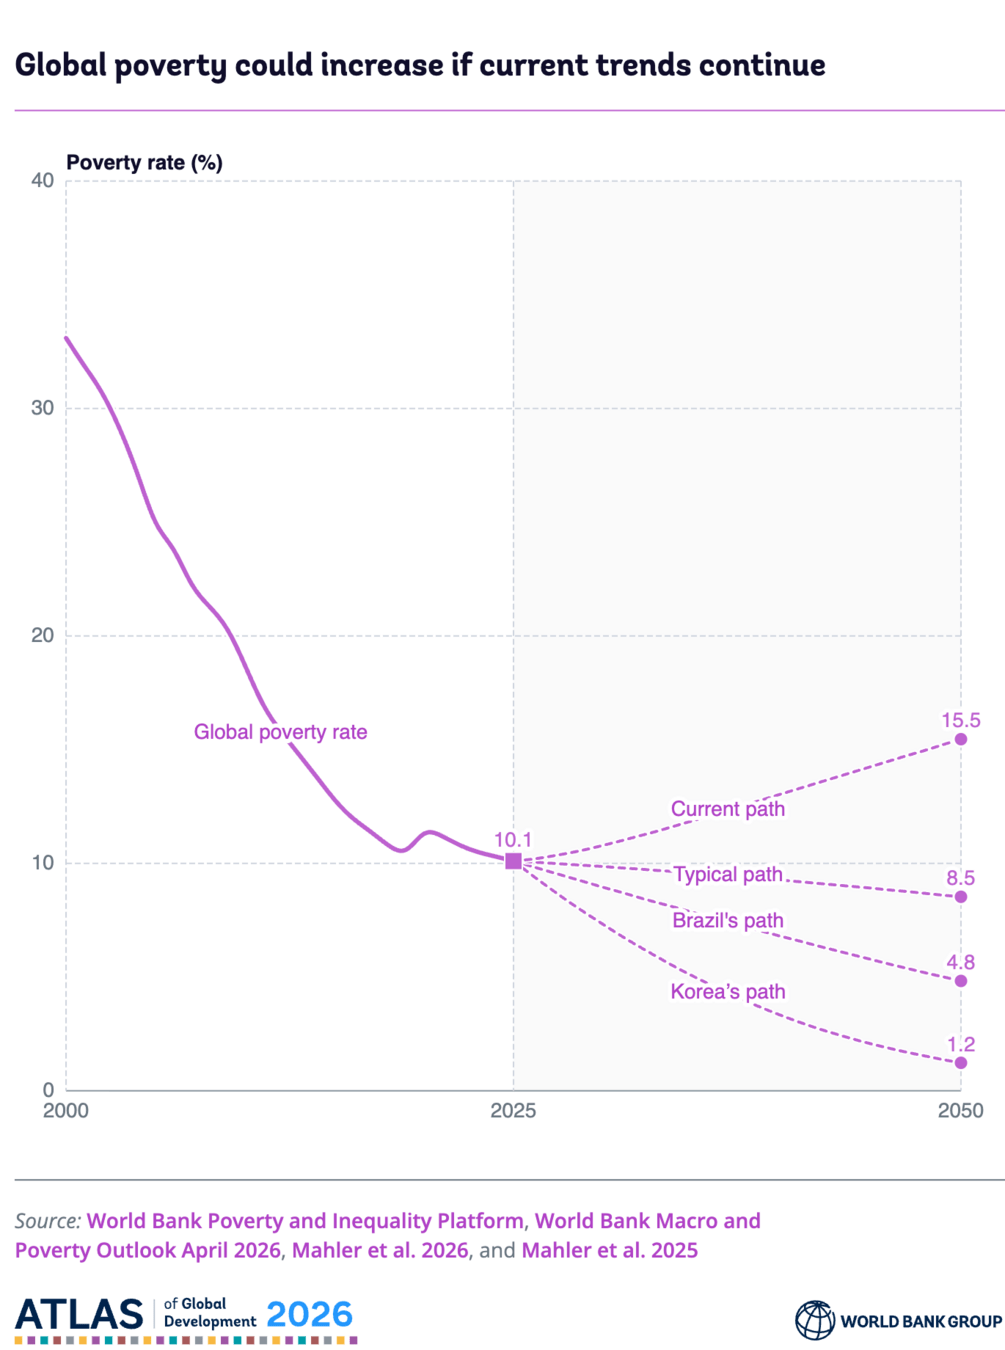
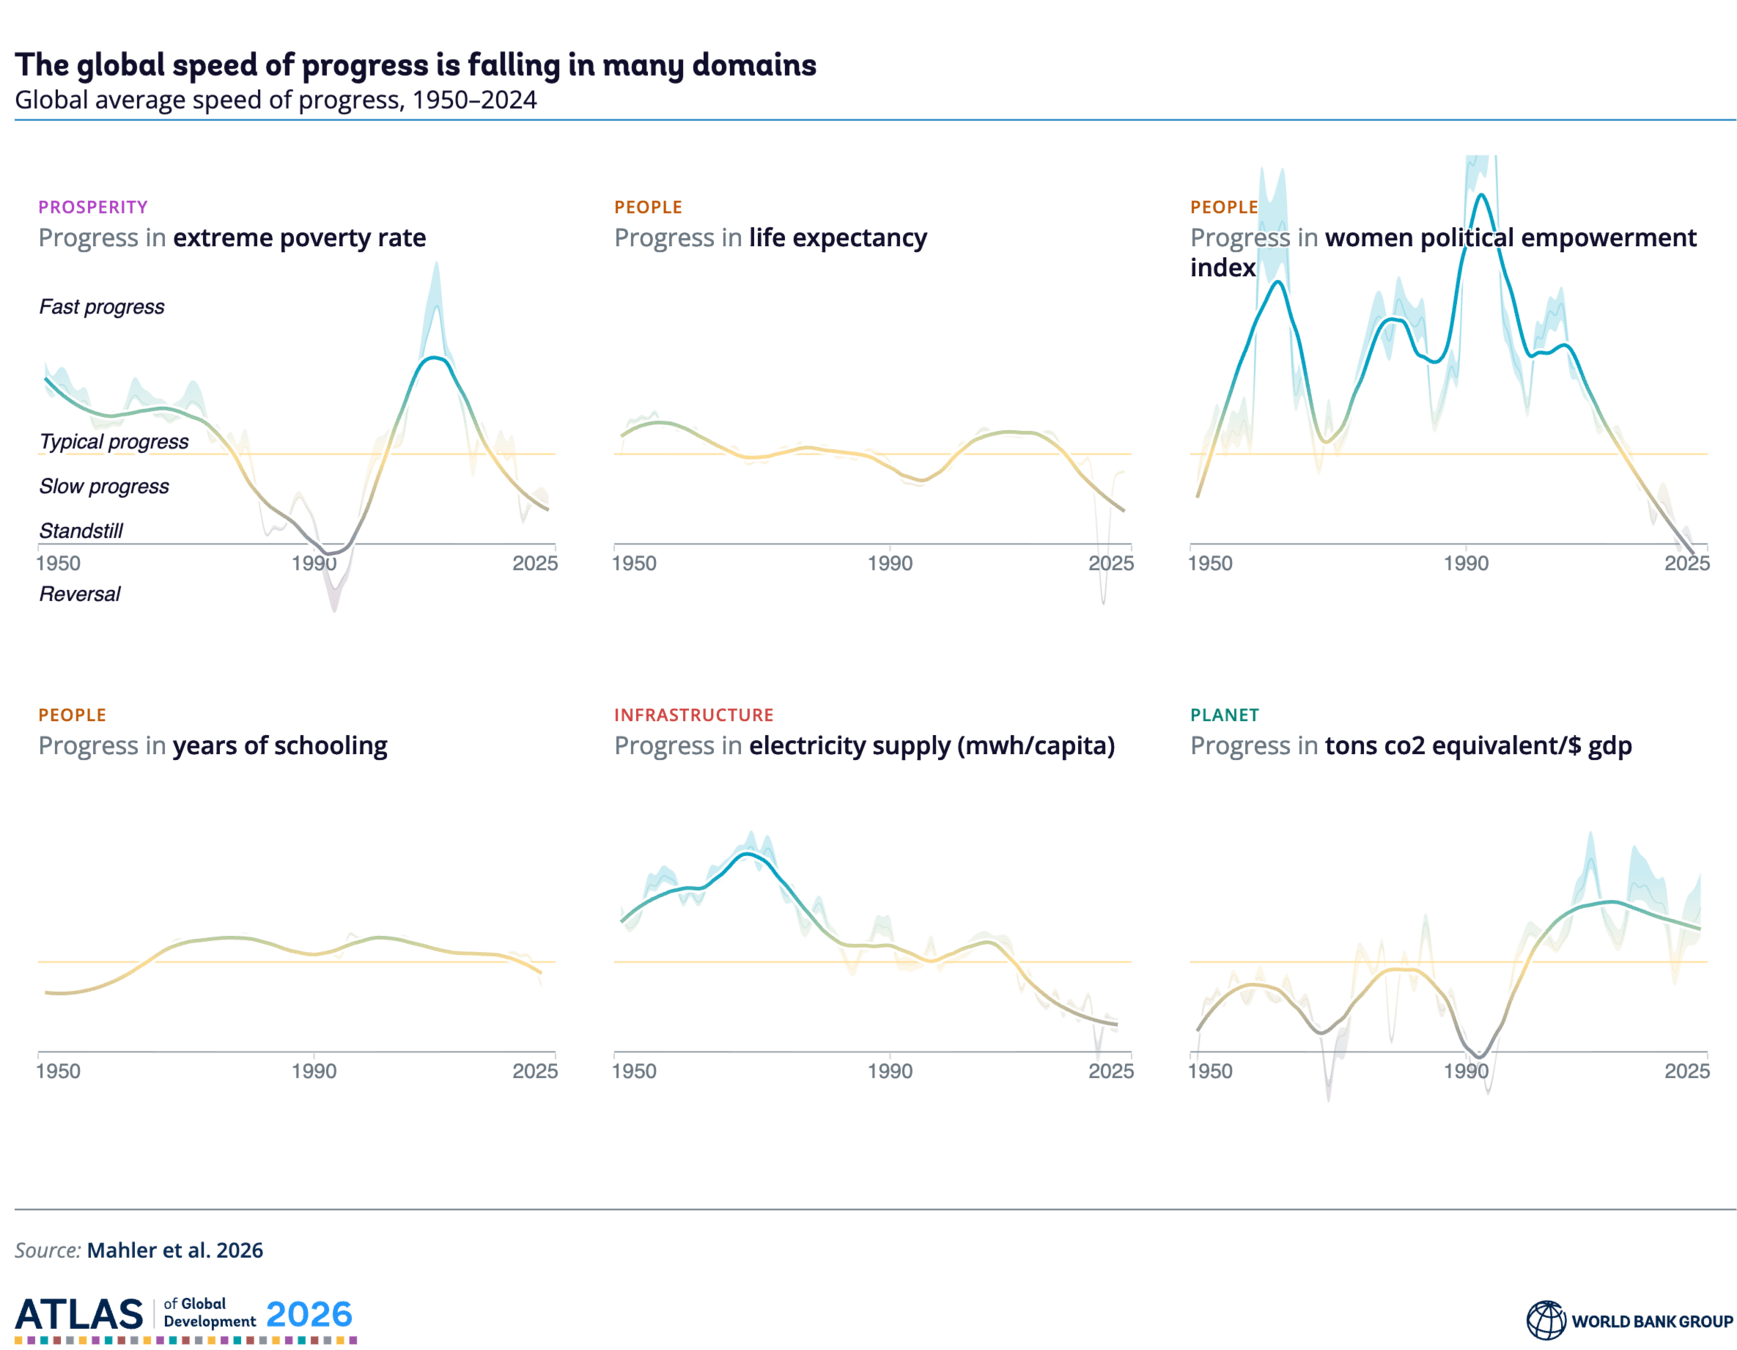
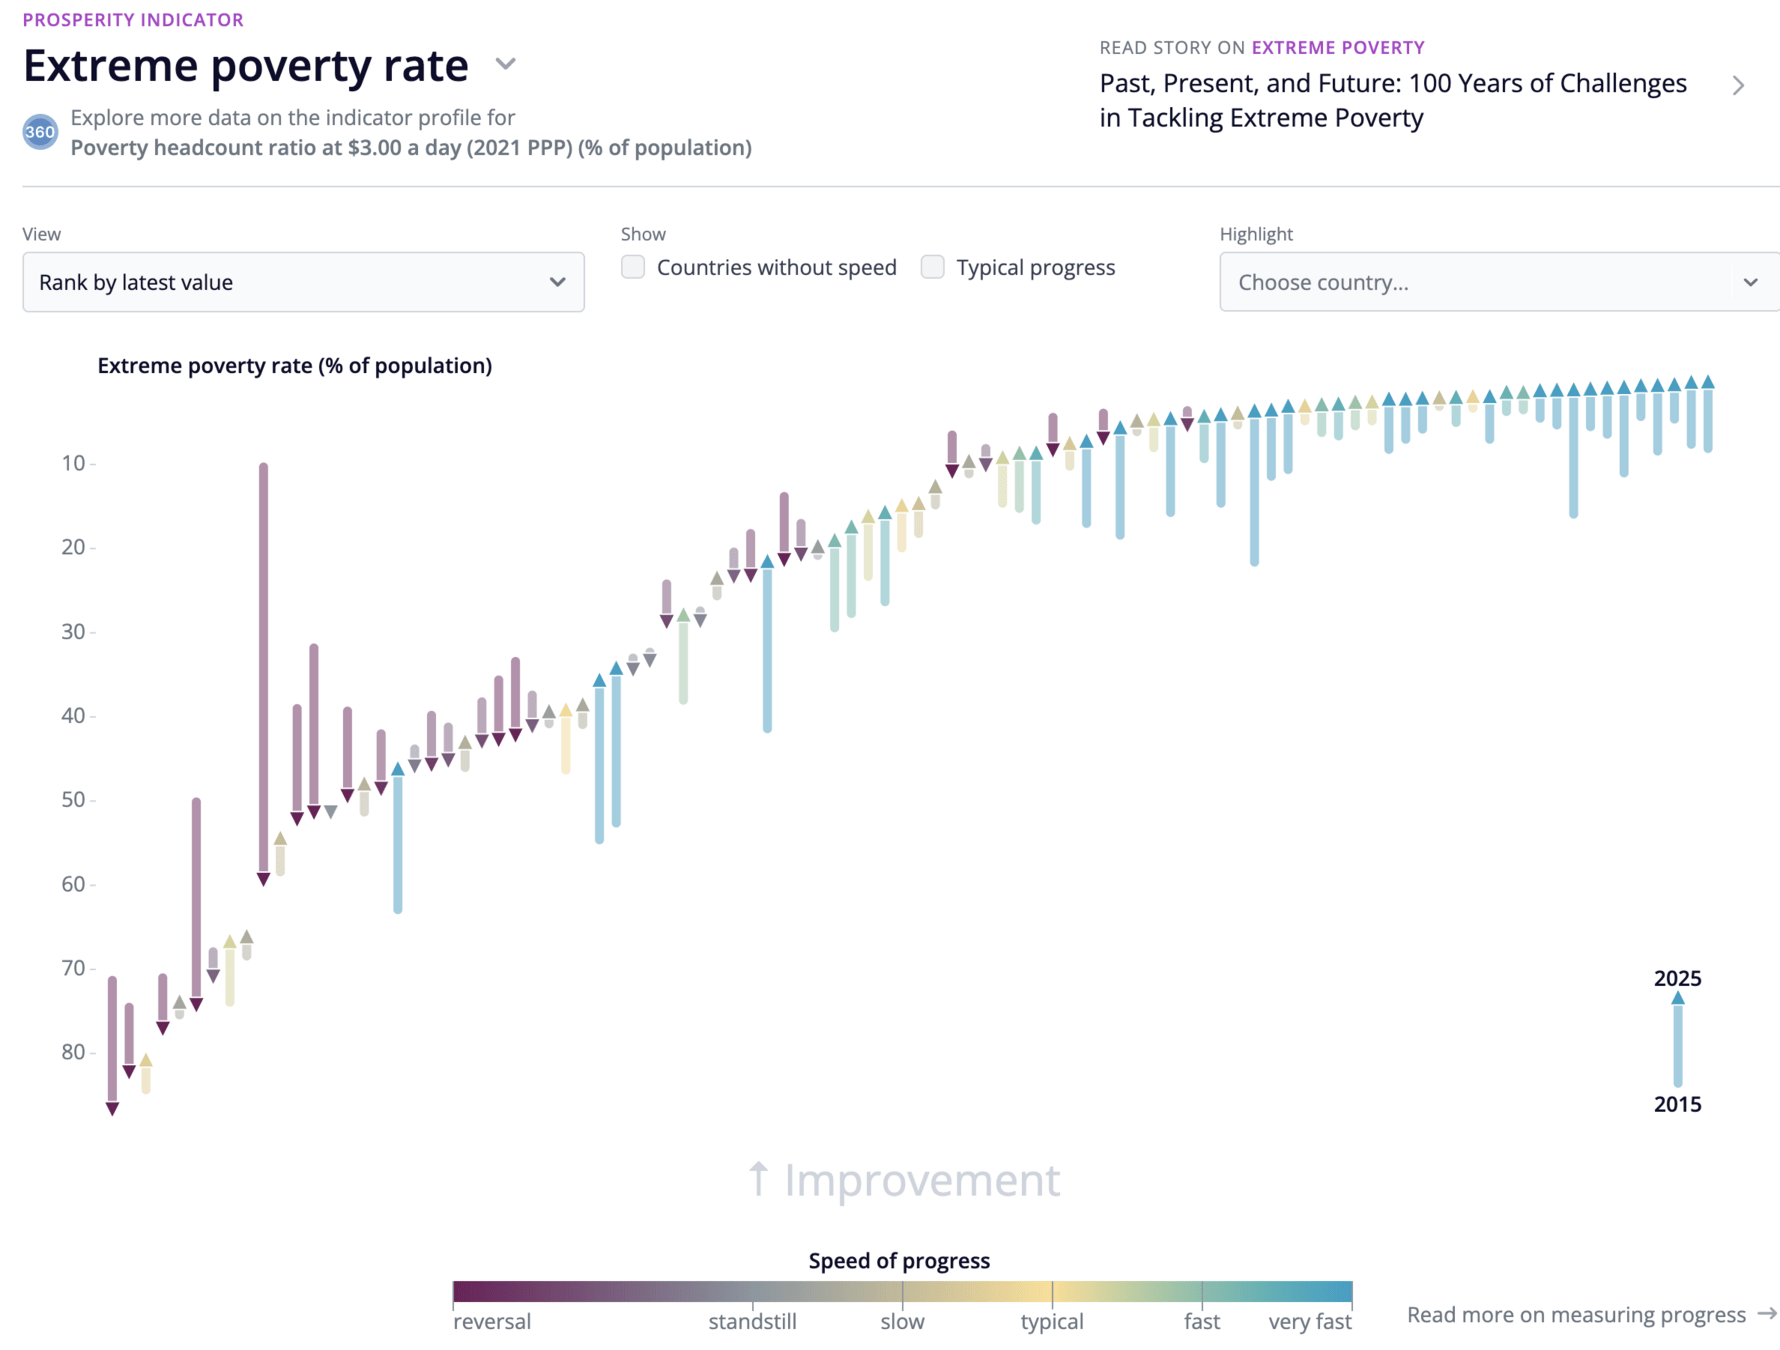
Data visualizations as first class citizens
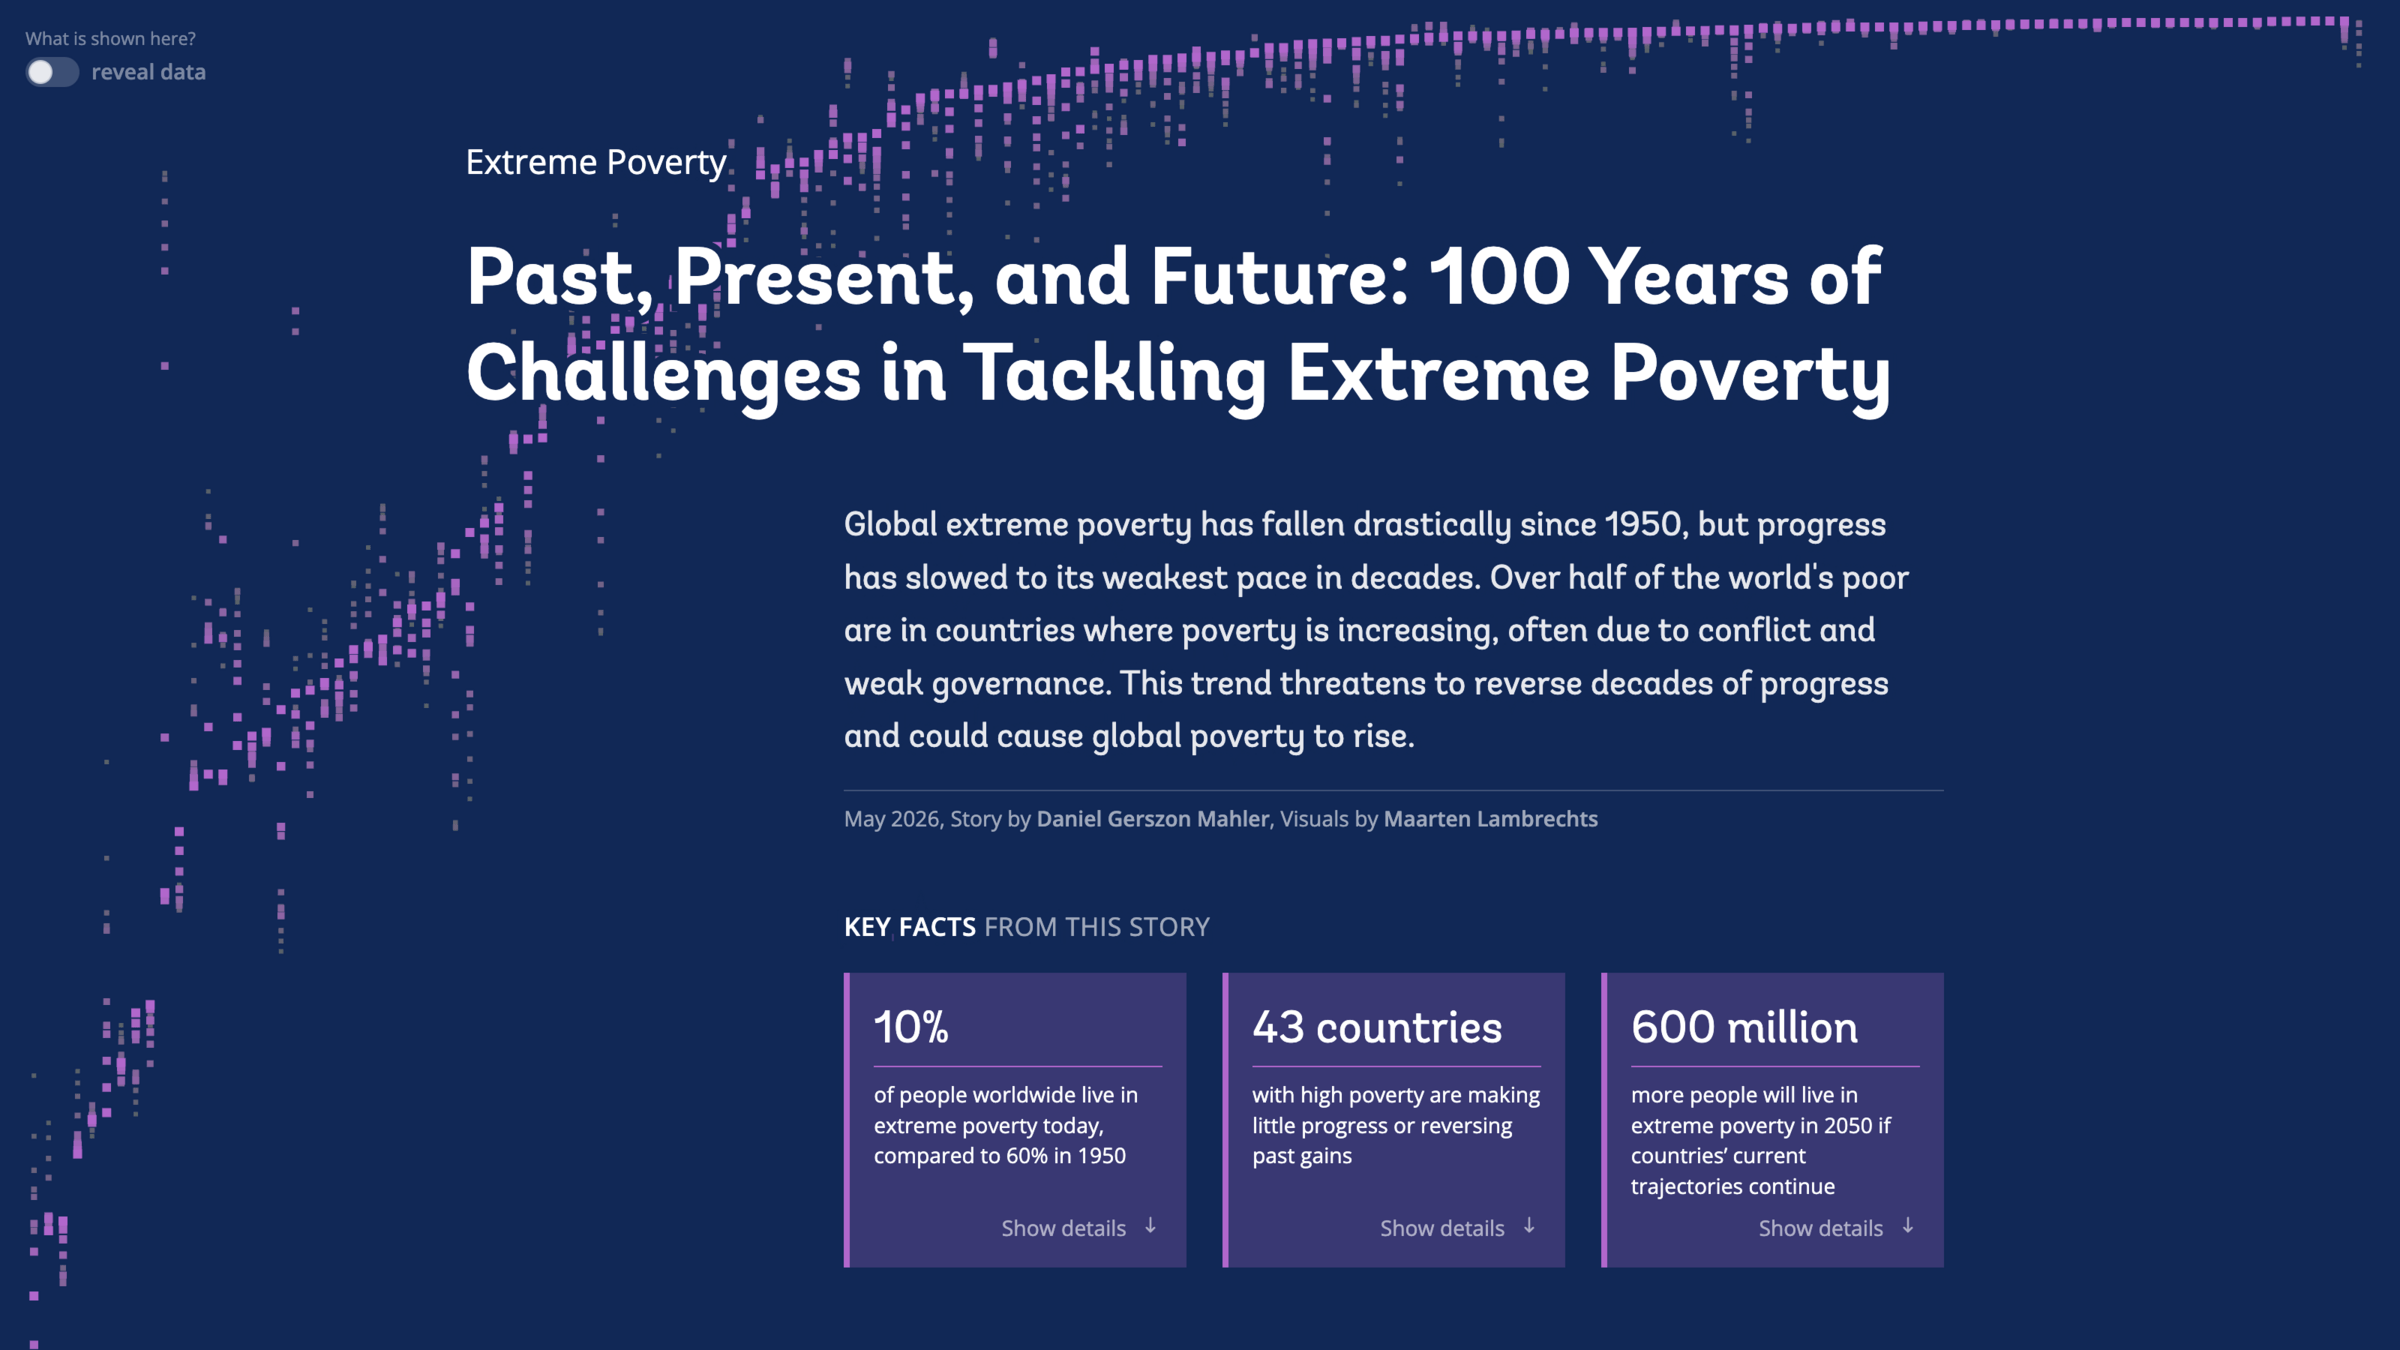
Collaborating on the Atlas
Story development
| Slides with visualization sketches & screenshots | Author(s) |
| Story outline review | Atlas team |
| Draft visualizations | Viz developer |
| Visualization review | Atlas team |
| Story review | Internal and external experts |
| Art direction | Designer |
| Final visualizations | Viz developer |
.xlsx
.tif
.shp, .dbf
html table
.dta, .do
.RData
.json
APIs
.csv





Preview siteLive siteShared components, colors, color palettes => DV style guide
Art direction
Coherence
Takeaways
Invest in your tech stack
Body text
Meet in the middle with experts
Viz people: learn about the topic, the jargon, the data
Experts: develop a visual mindset
Make visualizations first class
Body text
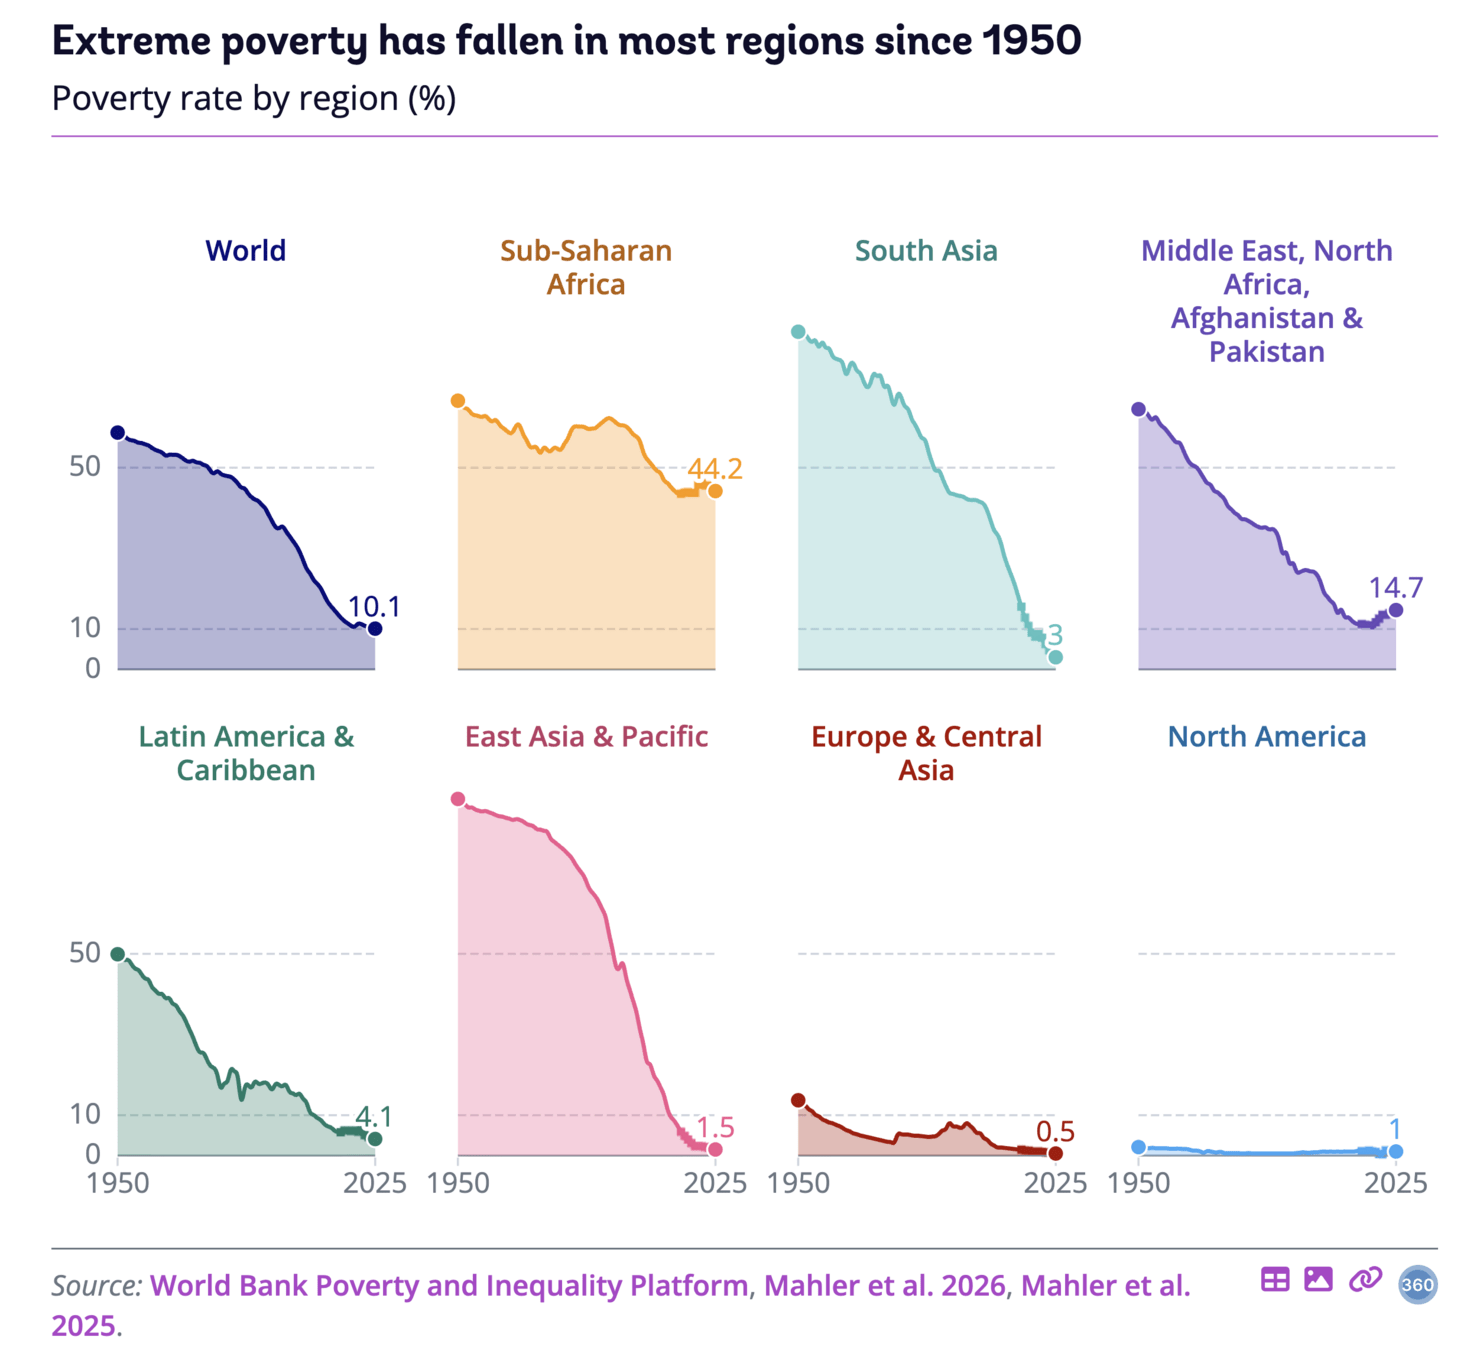
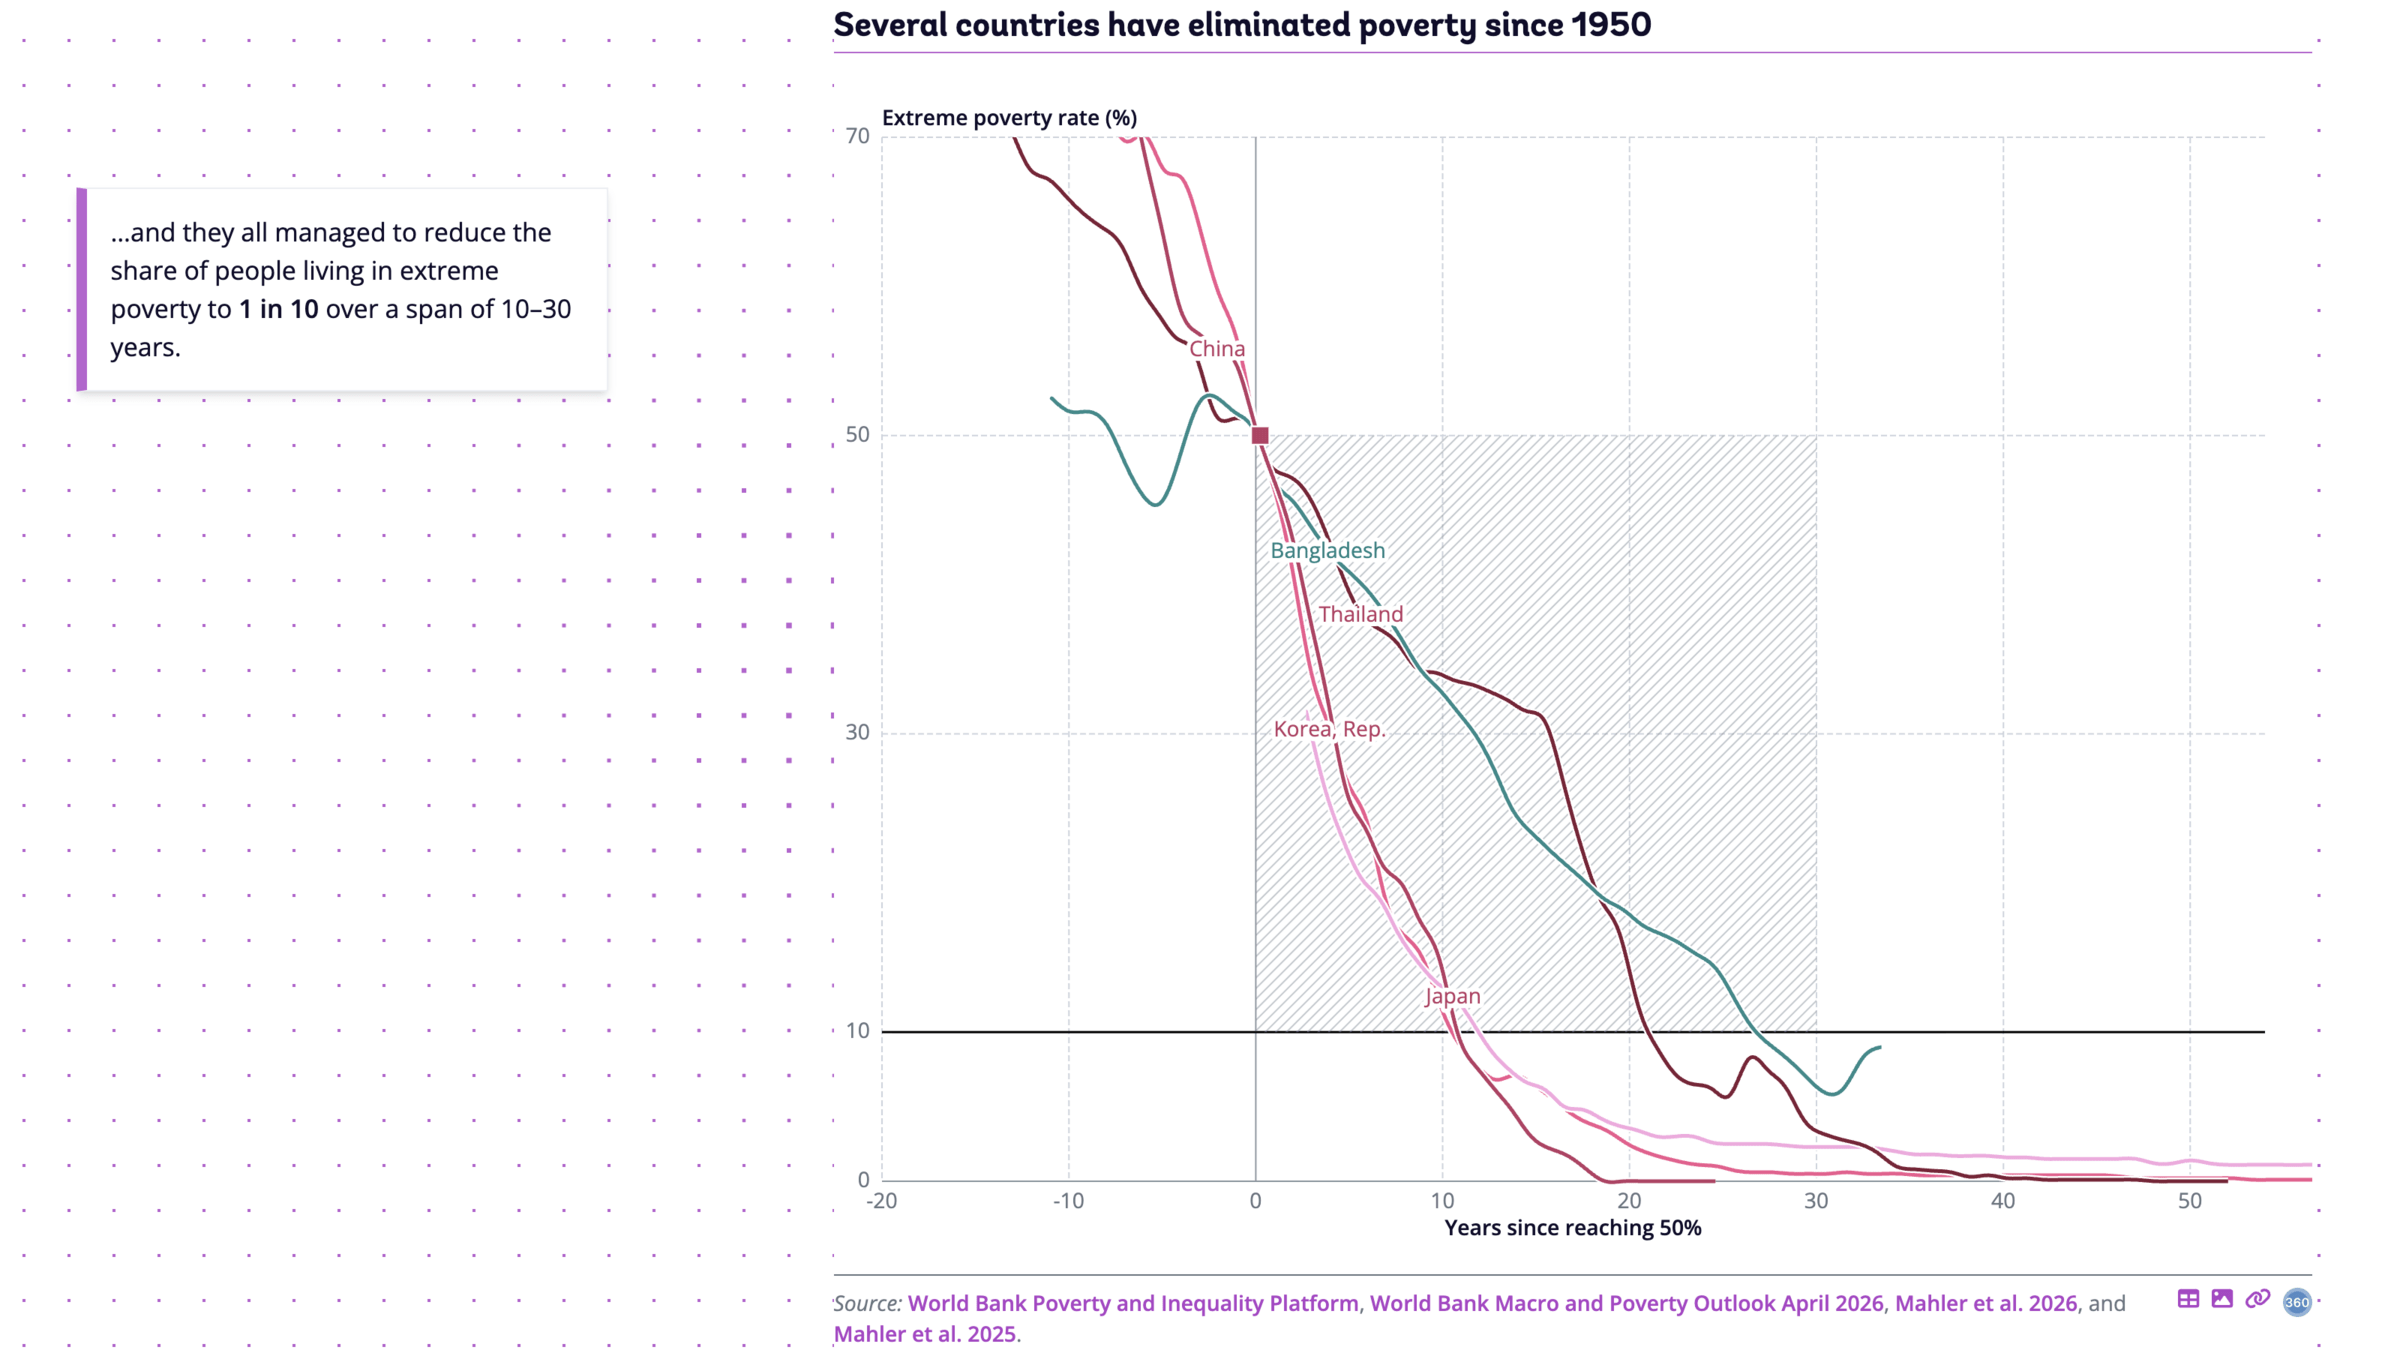
Measure progress in a fair way
Check our method
Takeaways
The Atlas of Global Development: How to measure progress and communicate global trends
By maartenzam